UNITED STATES
SECURITIES AND EXCHANGE COMMISSION
Washington, D.C. 20549
____________________________________________________________
FORM 8-K
____________________________________________________________
CURRENT REPORT
Pursuant to Section 13 or 15(d) of The Securities Exchange Act of 1934
Date of Report (Date of earliest event reported): August 3, 2026
____________________________________________________________
(Exact name of registrant as specified in its charter)
____________________________________________________________
| (State or other jurisdiction of incorporation) | (Commission File Number) | (IRS Employer Identification No.) | ||||||
| (Address of principal executive offices) | (Zip Code) | ||||||||||
| (Registrant’s telephone number, including area code) | |||||||||||
____________________________________________________________
Check the appropriate box below if the Form 8-K filing is intended to simultaneously satisfy the filing obligation of the registrant under any of the following provisions:
Securities registered pursuant to Section 12(b) of the Act:
| Title of each class | Trading Symbol(s) | Name of each exchange on which registered | ||||||
Indicate by check mark whether the registrant is an emerging growth company as defined in as defined in Rule 405 of the Securities Act of 1933 (§230.405 of this chapter) or Rule 12b-2 of the Securities Exchange Act of 1934 (§240.12b-2 of this chapter).
Emerging growth company ☐
If an emerging growth company, indicate by check mark if the registrant has elected not to use the extended transition period for complying with any new or revised financial accounting standards provided pursuant to Section 13(a) of the Exchange Act. ☐
Item 7.01 REGULATION FD DISCLOSURE
On August 3, 2026, Glacier Bancorp, Inc. (“Company”), Kalispell, Montana, made an investor presentation which is also posted on its website. The presentation is furnished as Exhibit 99.1 to this report.
Item 9.01 FINANCIAL STATEMENTS AND EXHIBITS
(d) Exhibits
The investor presentation described in Item 7.01 is furnished with this report as Exhibit 99.1.
99.1 Investor Presentation
104 Cover Page Interactive Data File (embedded within the Inline XBRL document).
SIGNATURES
Pursuant to the requirements of the Securities Exchange Act of 1934, the registrant has duly caused this report to be signed on its behalf by the undersigned hereunto duly authorized.
| Dated: | August 3, 2026 | GLACIER BANCORP, INC. | |||||||||
| /s/ Randall M. Chesler | |||||||||||
| By: | Randall M. Chesler | ||||||||||
| President and Chief Executive Officer | |||||||||||
June 2026
This presentation contains forward-looking statements within the meaning of the Private Securities Litigation Reform Act of 1995. These forward-looking statements include, but are not limited to, statements about the Company’s plans, objectives, expectations and intentions that are not historical facts, and other statements identified by words such as “expects,” “anticipates,” “will,” “intends,” “plans,” “believes,” “should,” “projects,” “seeks,” “estimates” or other comparable words or phrases of a future or forward-looking nature. These forward-looking statements are based on current beliefs and expectations of management and are inherently subject to significant business, economic and competitive uncertainties and contingencies, many of which are beyond the Company’s control. In addition, these forward-looking statements are based on assumptions that are subject to change. The following factors, among others, could cause actual results to differ materially from the anticipated results (express or implied) or other expectations in the forward-looking statements: 1) Risks associated with lending and potential adverse changes in the credit quality of the Company’s loan portfolio; 2) Changes in monetary and fiscal policies, including interest rate policies of the Federal Reserve Board, which could adversely affect the Company’s net interest income and margin, the fair value of its financial instruments, profitability, and stockholders’ equity; 3) Legislative or regulatory changes, including the possibility of increases in FDIC insurance rates and assessments, changes in the review and regulation of bank mergers, or increases or changes in banking and consumer protection regulations, that may adversely affect the Company’s business and strategies; 4) Risks related to overall economic conditions, including the impact on the economy of an uncertain interest rate environment, inflationary pressures, recently passed legislation and the potential for significant additional changes in economic and trade policies in the current administration; 5) Risks to the Company’s business and the business of the Company’s customers arising from current or future tariffs or other trade restrictions, labor or supply chain issues, change in labor force, or geopolitical instability, including the wars in Iran and Ukraine, further conflicts in the Middle East, and potential for future conflicts or disruptions in other parts of the world; 6) Risks associated with the Company’s ability to negotiate, complete, and successfully integrate acquisitions; 7) Costs or difficulties related to the completion and integration of future or recently completed acquisitions; 8) Impairment of the goodwill recorded by the Company in connection with acquisitions, which may have an adverse impact on earnings and capital; 9) Reduction in demand for banking products and services, whether as a result of changes in customer behavior, economic conditions, banking environment, or competition; 10) Deterioration of the reputation of banks and the financial services industry, which could adversely affect the Company's ability to obtain and maintain customers; 11) Changes in the competitive landscape, including as may result from new market entrants, additional competition from internet-based financial institutions operating nationally, or further consolidation in the financial services industry, resulting in increased competition, including the creation of larger competitors with greater financial resources; 12) Risks presented by public stock market volatility, which could adversely affect the market price of the Company’s common stock and the ability to raise additional capital or grow through acquisitions; 13) Risks related to rapidly evolving artificial intelligence technologies; 14) Risks associated with dependence on the Chief Executive Officer, the senior management team and the Presidents of Glacier Bank’s divisions; 15) Material failure, potential interruption or breach in security of the Company’s systems or changes in technology which could expose the Company to cybersecurity risks, fraud, system failures, or direct liabilities; 16) Risks related to natural disasters, including droughts, fires, floods, earthquakes, pandemics, and other unexpected events; 17) Success in managing risks involved in any of the foregoing; and 18) Effects of any reputational damage to the Company resulting from any of the foregoing.
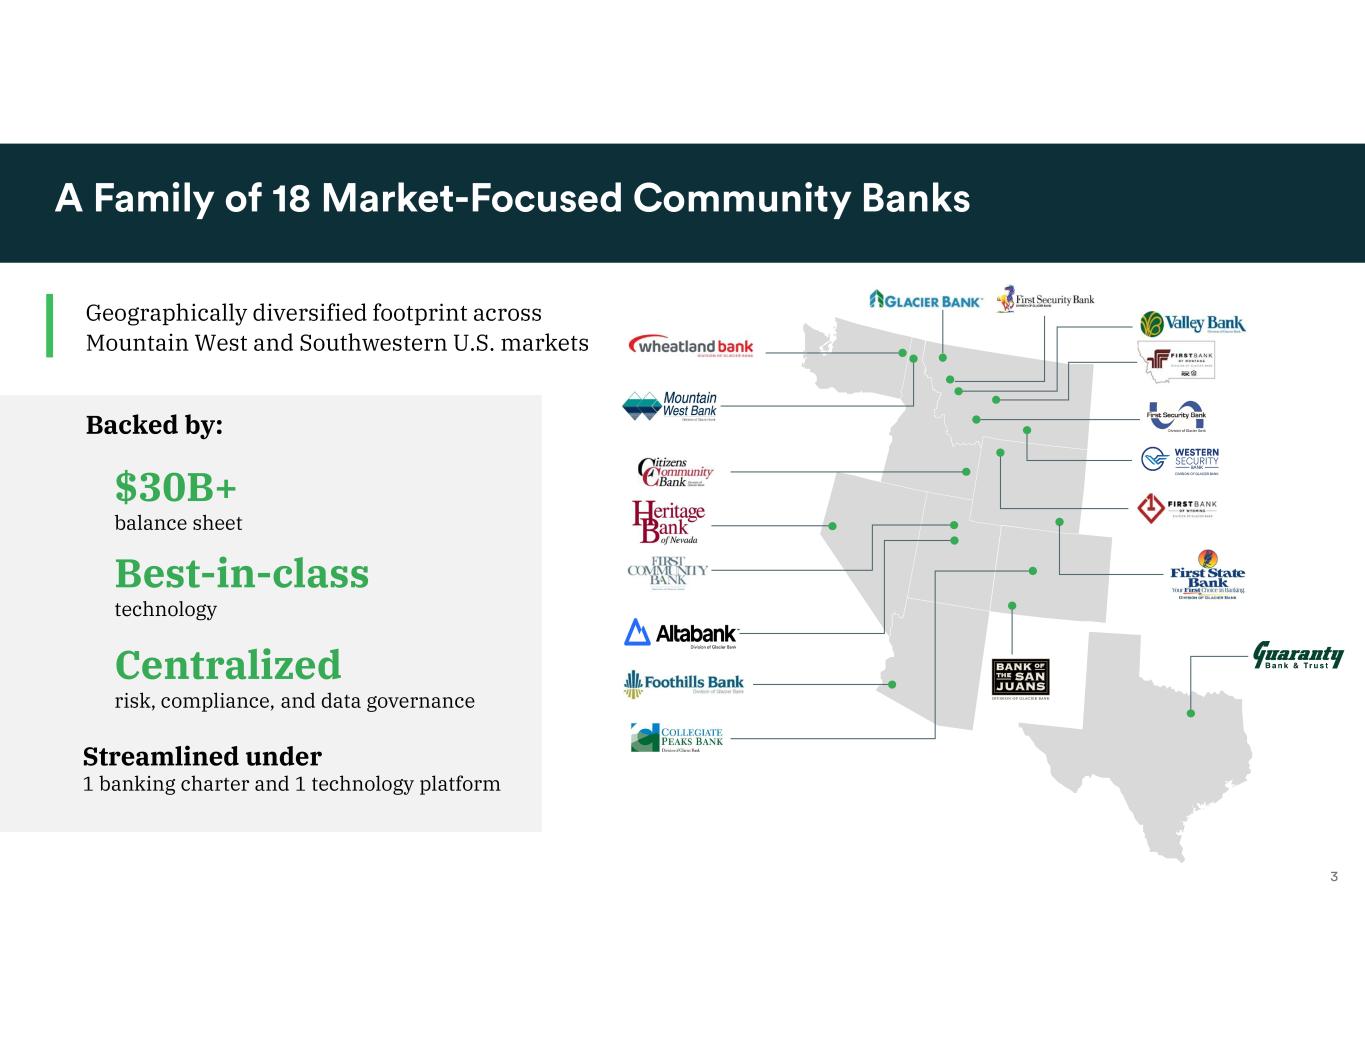
Geographically diversified footprint across Mountain West and Southwestern U.S. markets $30B+ balance sheet Best-in-class technology Centralized risk, compliance, and data governance Backed by: Streamlined under 1 banking charter and 1 technology platform
Our ongoing mission is to be the premier banking franchise in the Mountain West and Southwest, delivering community bank values with big bank capabilities. We will continue to position the company as the acquirer of choice among community banks, the employer of choice within each of our communities and the bank of choice for all customers.
Differentiated, scalable community banking platform Attractive footprint in high-growth U.S. markets Strong team of division presidents with deep institutional and local market knowledge High-quality balance sheet anchored by low-cost, stable core deposits and superior credit quality Balanced growth strategy focused on both organic and future M&A Track record of resilient financial performance and shareholder returns
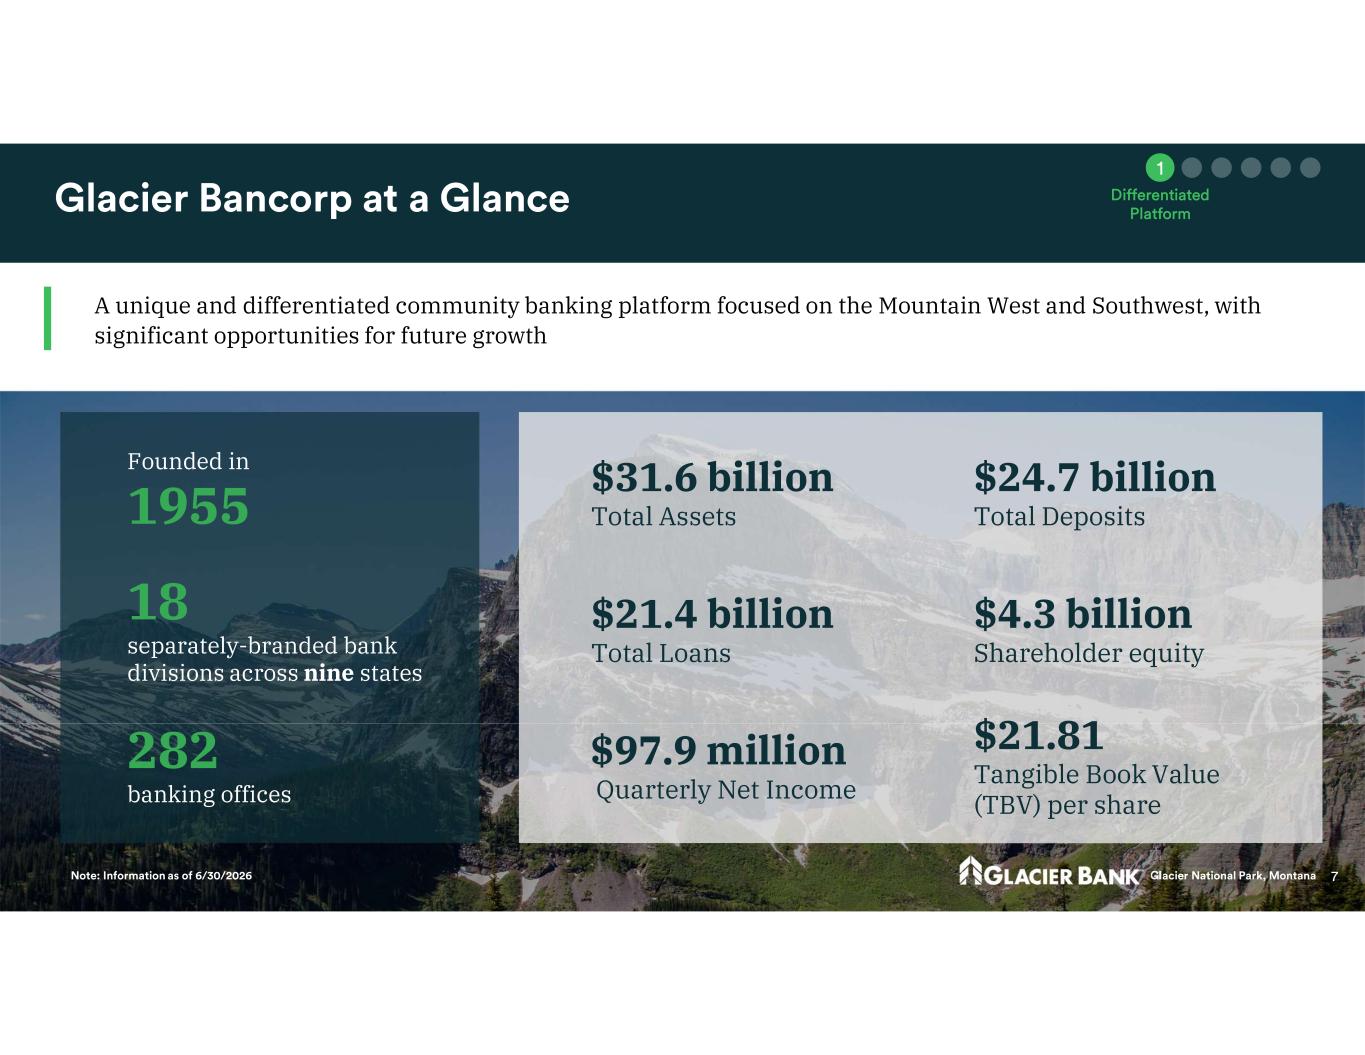
18 separately-branded bank divisions across nine states $4.3 billion Shareholder equity $21.4 billion Total Loans $31.6 billion Total Assets $24.7 billion Total Deposits Founded in 1955 282 banking offices $97.9 million Quarterly Net Income $21.81 Tangible Book Value (TBV) per share A unique and differentiated community banking platform focused on the Mountain West and Southwest, with significant opportunities for future growth
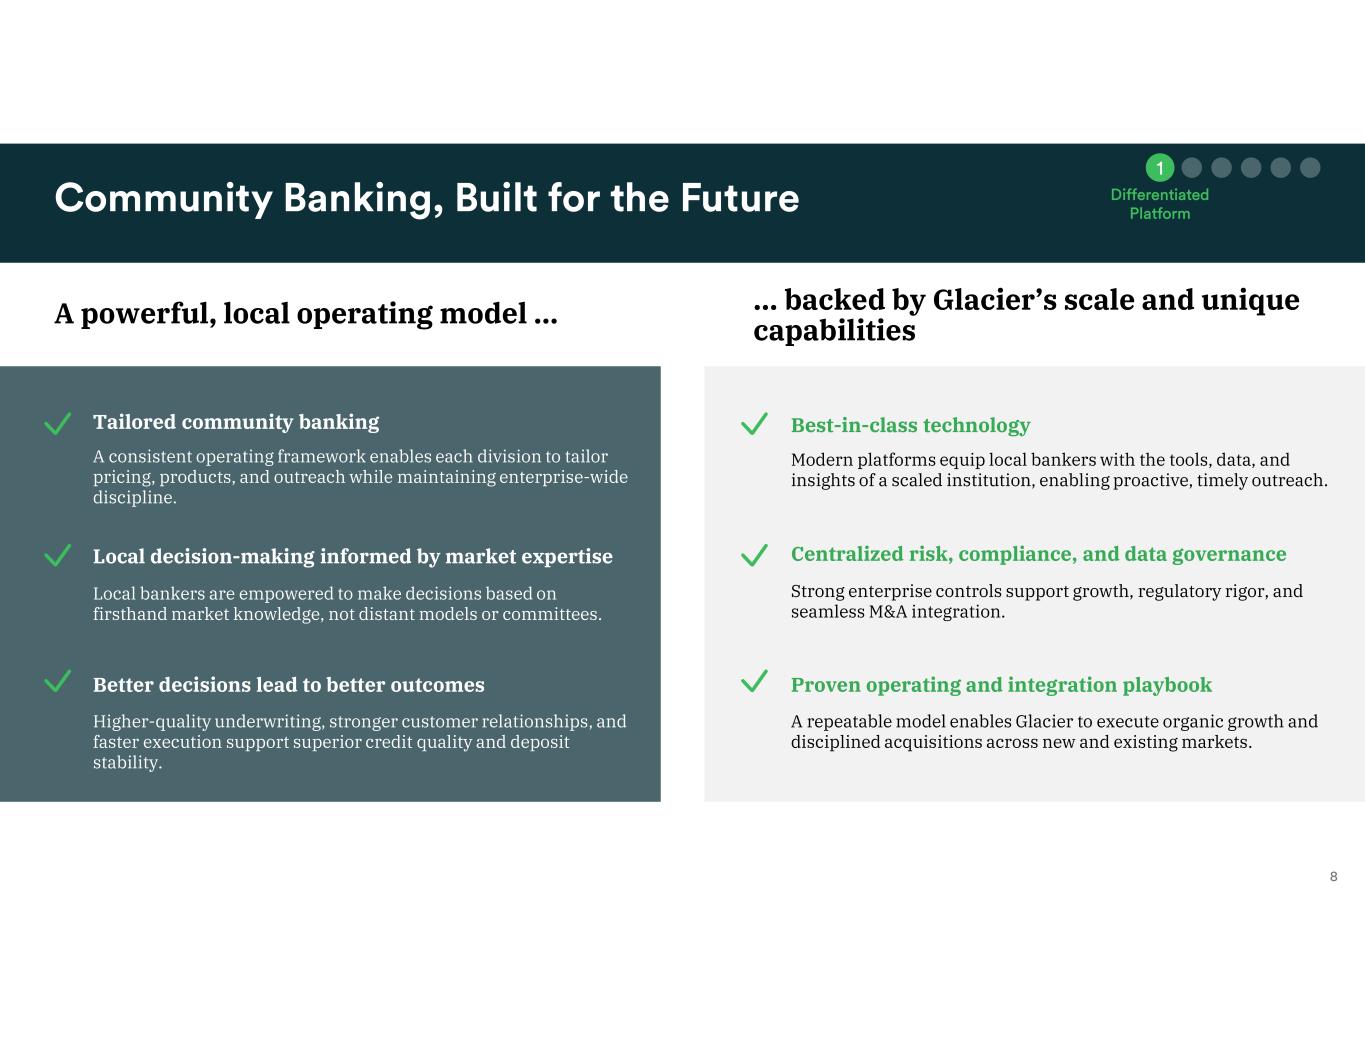
A powerful, local operating model … … backed by Glacier’s scale and unique capabilities Tailored community banking Local decision-making informed by market expertise Better decisions lead to better outcomes A consistent operating framework enables each division to tailor pricing, products, and outreach while maintaining enterprise-wide discipline. Local bankers are empowered to make decisions based on firsthand market knowledge, not distant models or committees. Higher-quality underwriting, stronger customer relationships, and faster execution support superior credit quality and deposit stability. Best-in-class technology Centralized risk, compliance, and data governance Proven operating and integration playbook Modern platforms equip local bankers with the tools, data, and insights of a scaled institution, enabling proactive, timely outreach. Strong enterprise controls support growth, regulatory rigor, and seamless M&A integration. A repeatable model enables Glacier to execute organic growth and disciplined acquisitions across new and existing markets.
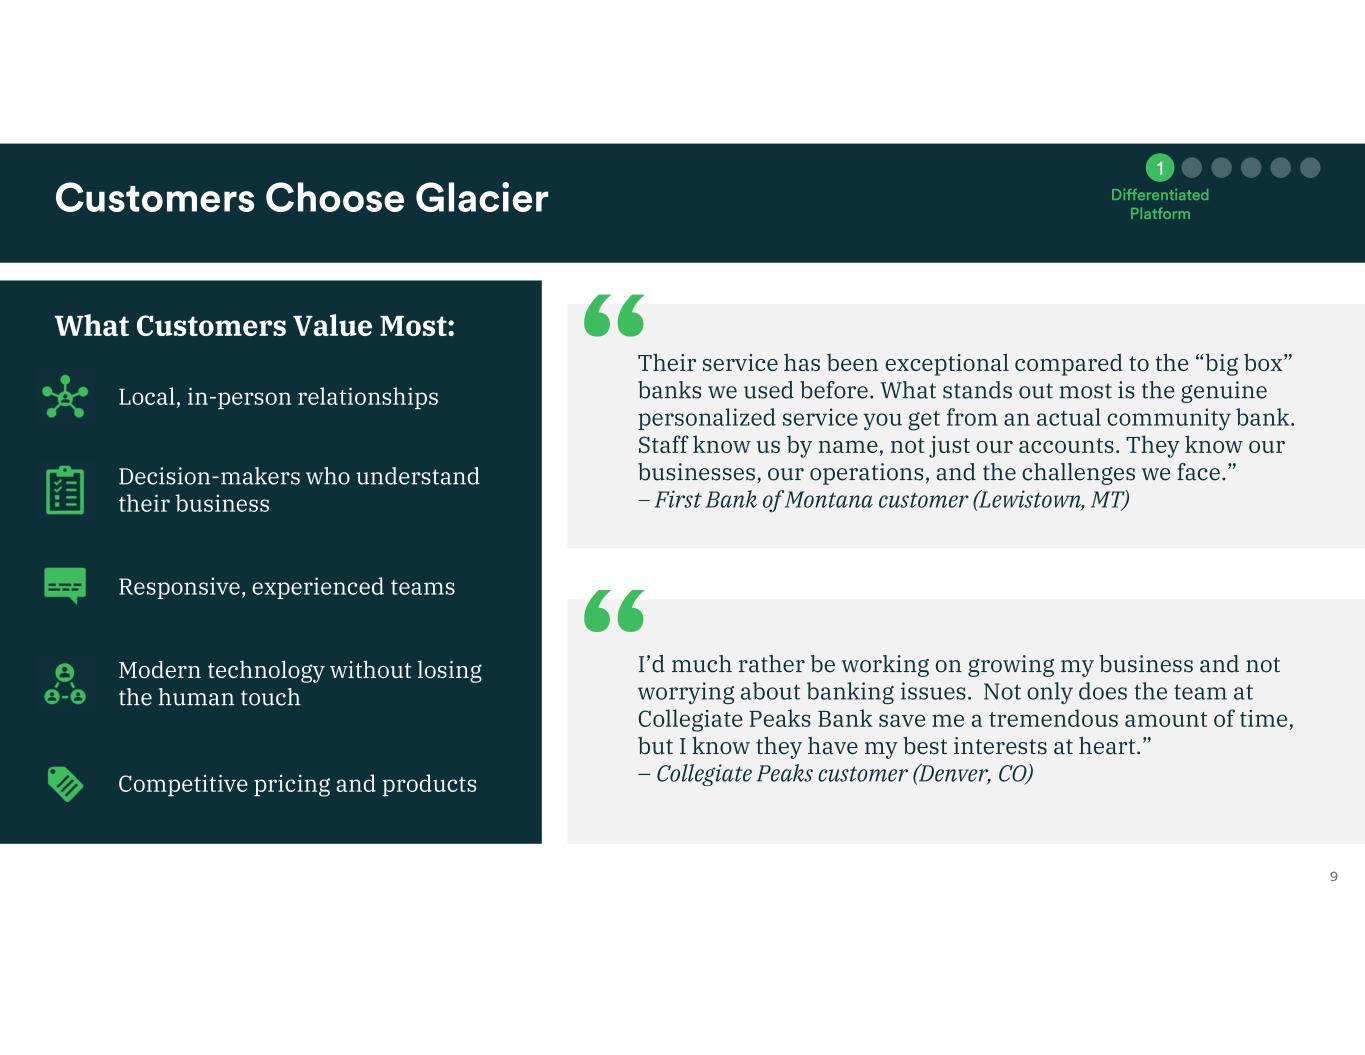
What Customers Value Most: Local, in-person relationships Decision-makers who understand their business Responsive, experienced teams Modern technology without losing the human touch Competitive pricing and products Their service has been exceptional compared to the “big box” banks we used before. What stands out most is the genuine personalized service you get from an actual community bank. Staff know us by name, not just our accounts. They know our businesses, our operations, and the challenges we face.” – First Bank of Montana customer (Lewistown, MT) I’d much rather be working on growing my business and not worrying about banking issues. Not only does the team at Collegiate Peaks Bank save me a tremendous amount of time, but I know they have my best interests at heart.” – Collegiate Peaks customer (Denver, CO)
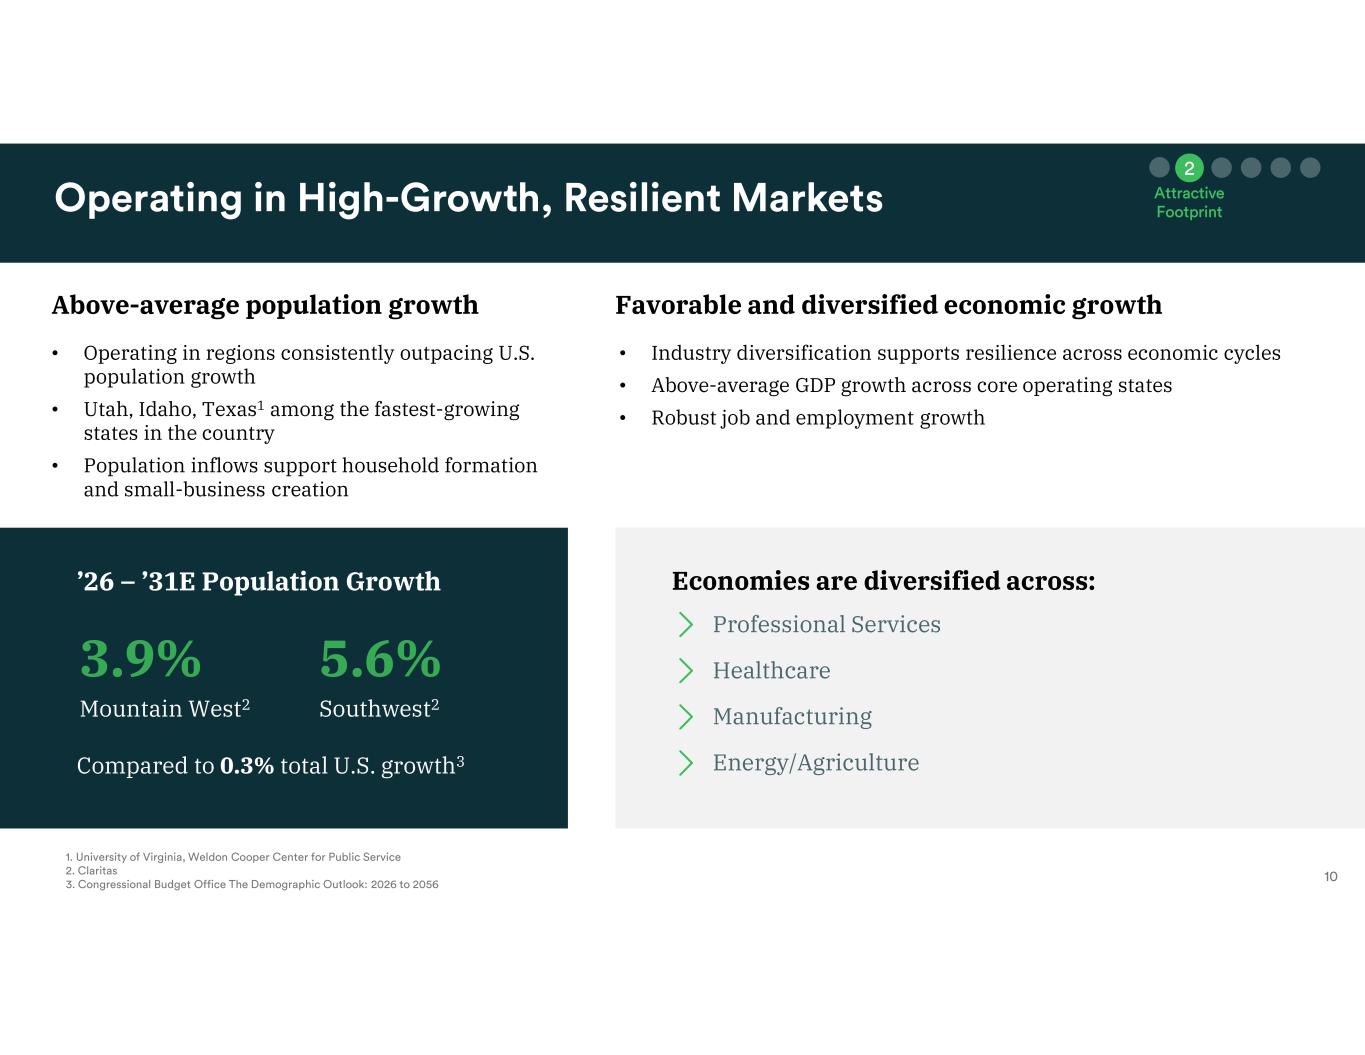
Above-average population growth Favorable and diversified economic growth • Operating in regions consistently outpacing U.S. population growth • Utah, Idaho, Texas1 among the fastest-growing states in the country • Population inflows support household formation and small-business creation 3.9% Mountain West2 5.6% Southwest2 ’26 – ’31E Population Growth Compared to 0.3% total U.S. growth3 Economies are diversified across: • Industry diversification supports resilience across economic cycles • Above-average GDP growth across core operating states • Robust job and employment growth Healthcare Professional Services Manufacturing Energy/Agriculture
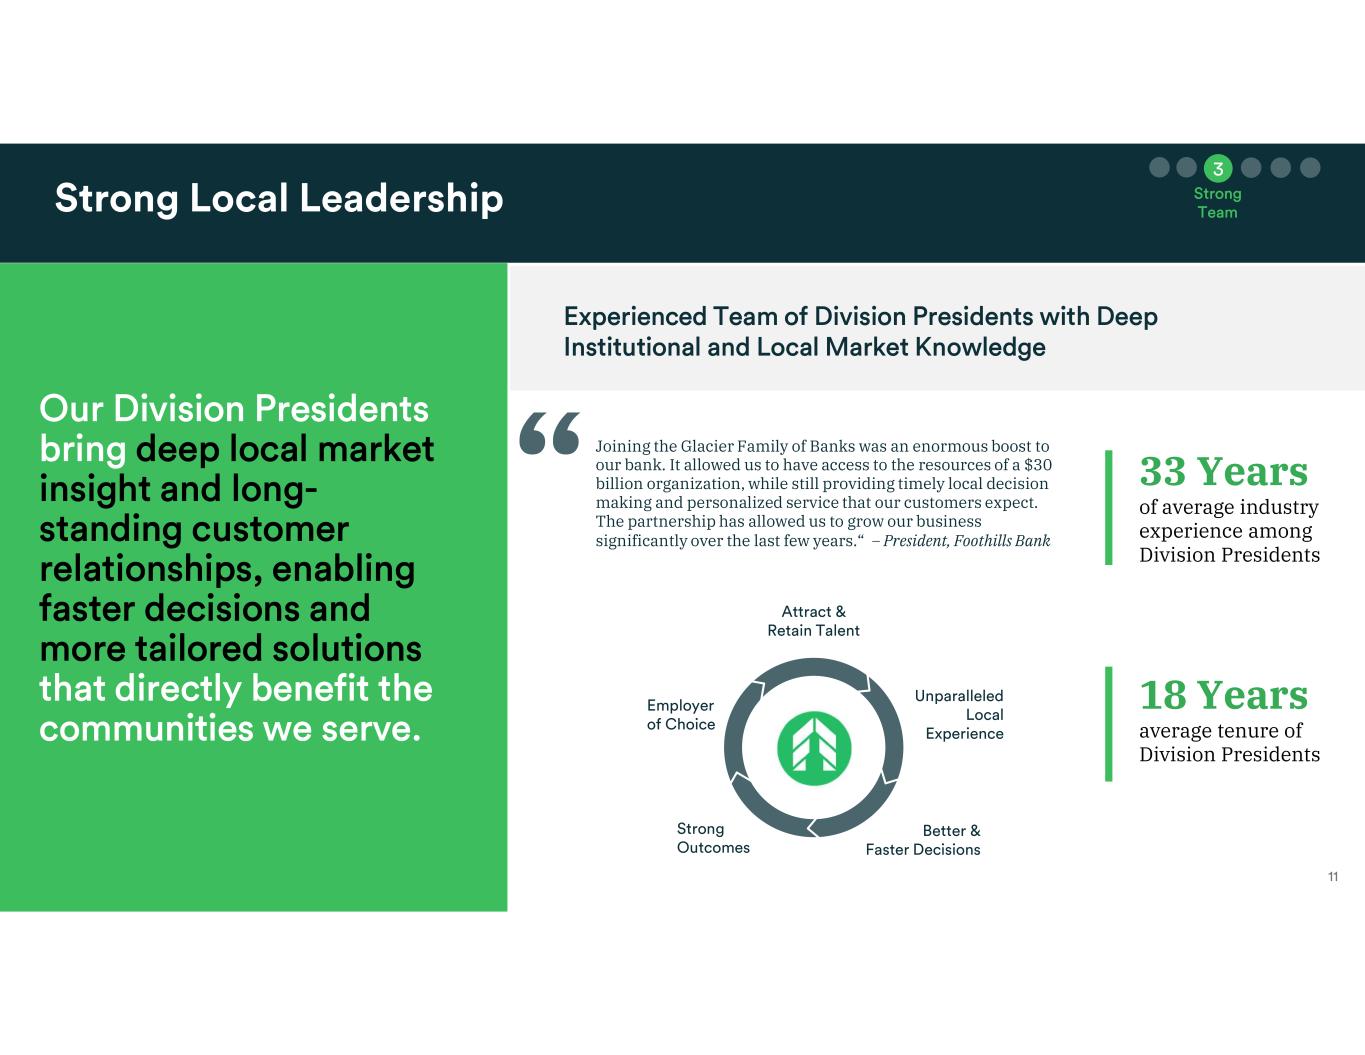
18 Years average tenure of Division Presidents 33 Years of average industry experience among Division Presidents Joining the Glacier Family of Banks was an enormous boost to our bank. It allowed us to have access to the resources of a $30 billion organization, while still providing timely local decision making and personalized service that our customers expect. The partnership has allowed us to grow our business significantly over the last few years.“ – President, Foothills Bank
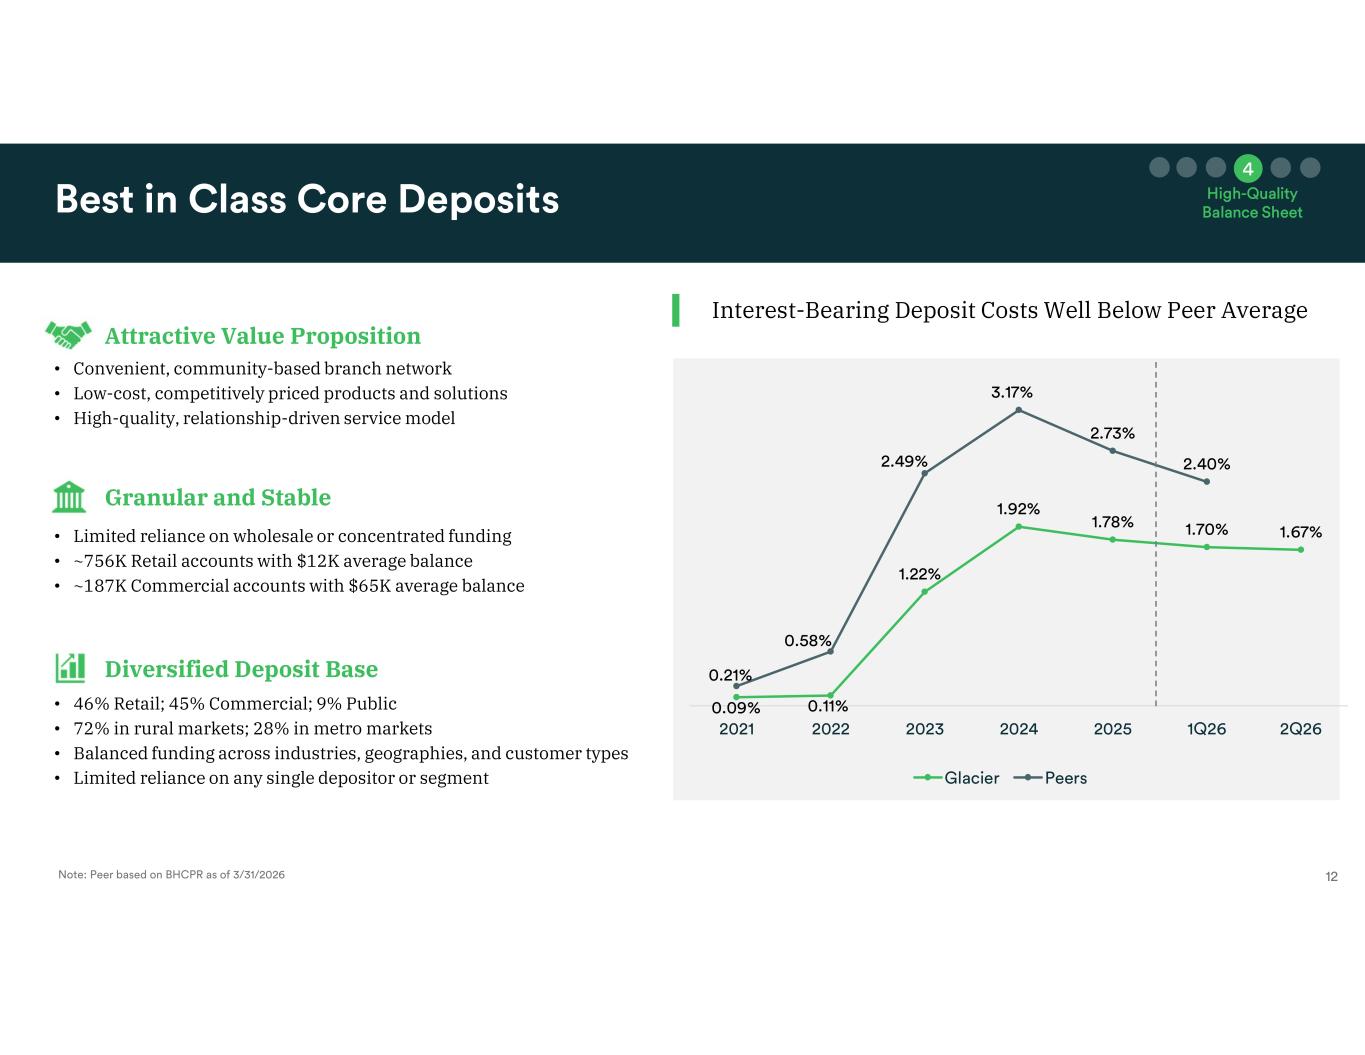
Interest-Bearing Deposit Costs Well Below Peer Average Attractive Value Proposition Granular and Stable Diversified Deposit Base • Convenient, community-based branch network • Low-cost, competitively priced products and solutions • High-quality, relationship-driven service model • Limited reliance on wholesale or concentrated funding • ~756K Retail accounts with $12K average balance • ~187K Commercial accounts with $65K average balance • 46% Retail; 45% Commercial; 9% Public • 72% in rural markets; 28% in metro markets • Balanced funding across industries, geographies, and customer types • Limited reliance on any single depositor or segment
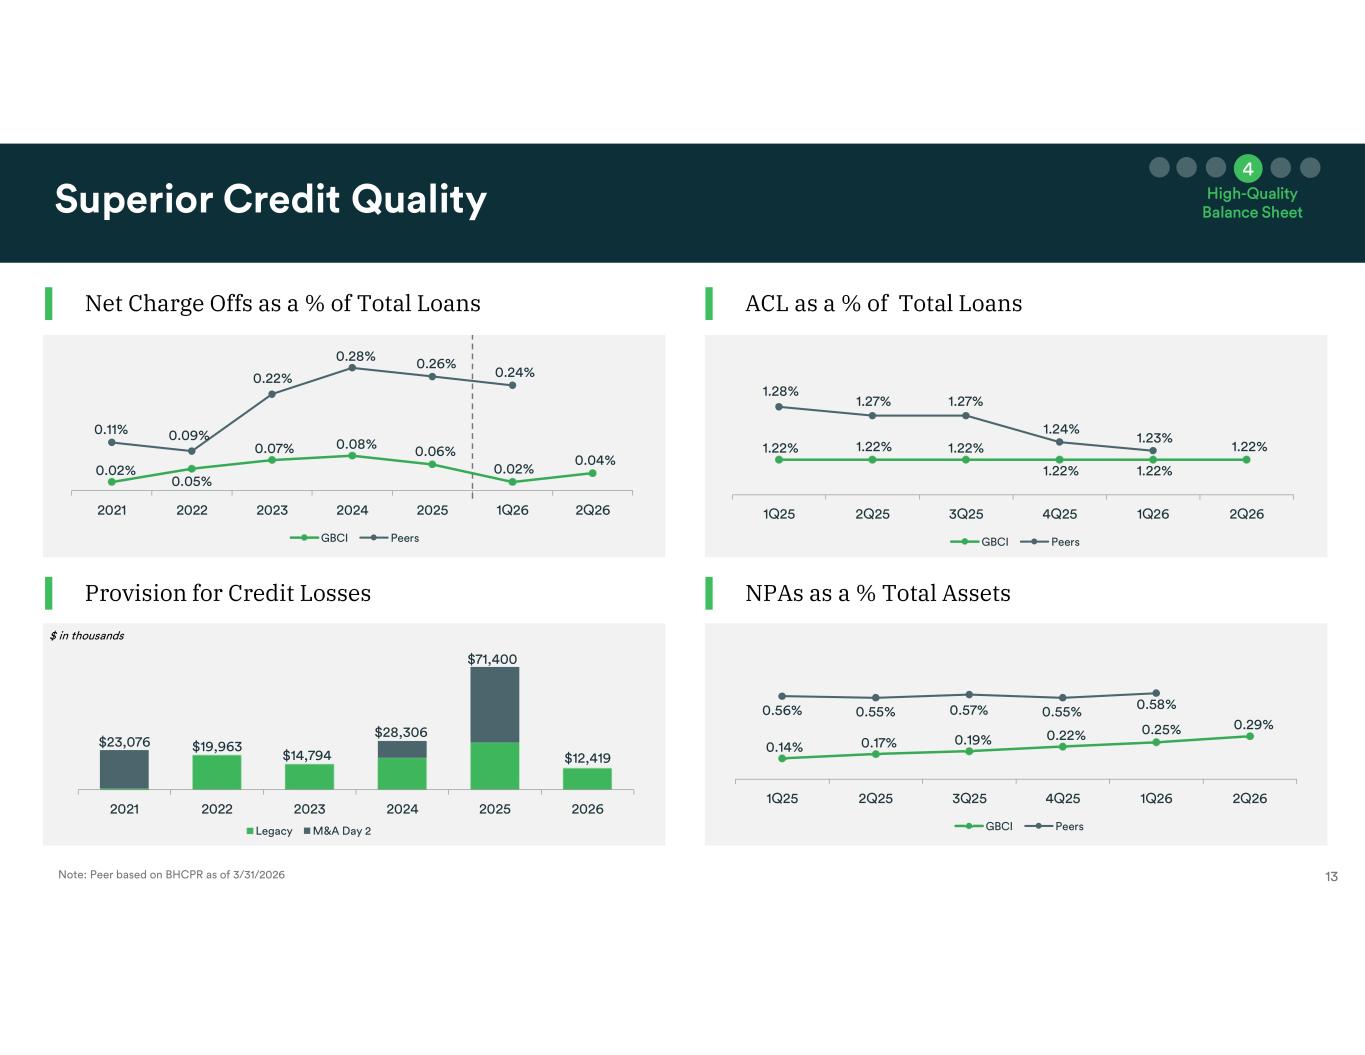
Net Charge Offs as a % of Total Loans Provision for Credit Losses ACL as a % of Total Loans NPAs as a % Total Assets
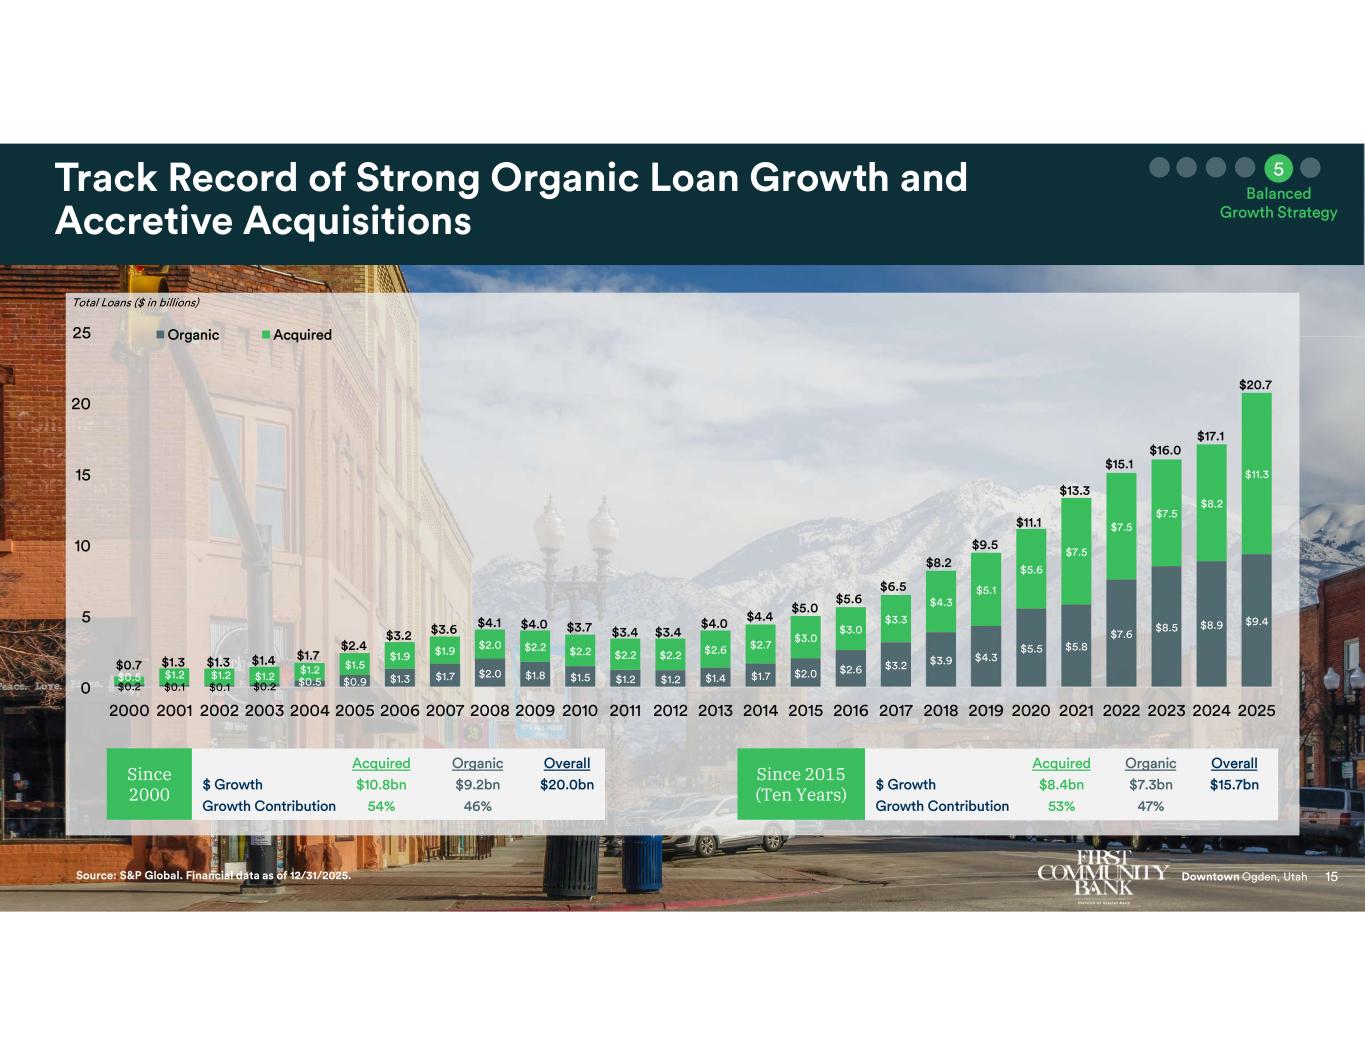
Since 2000 Since 2015 (Ten Years)
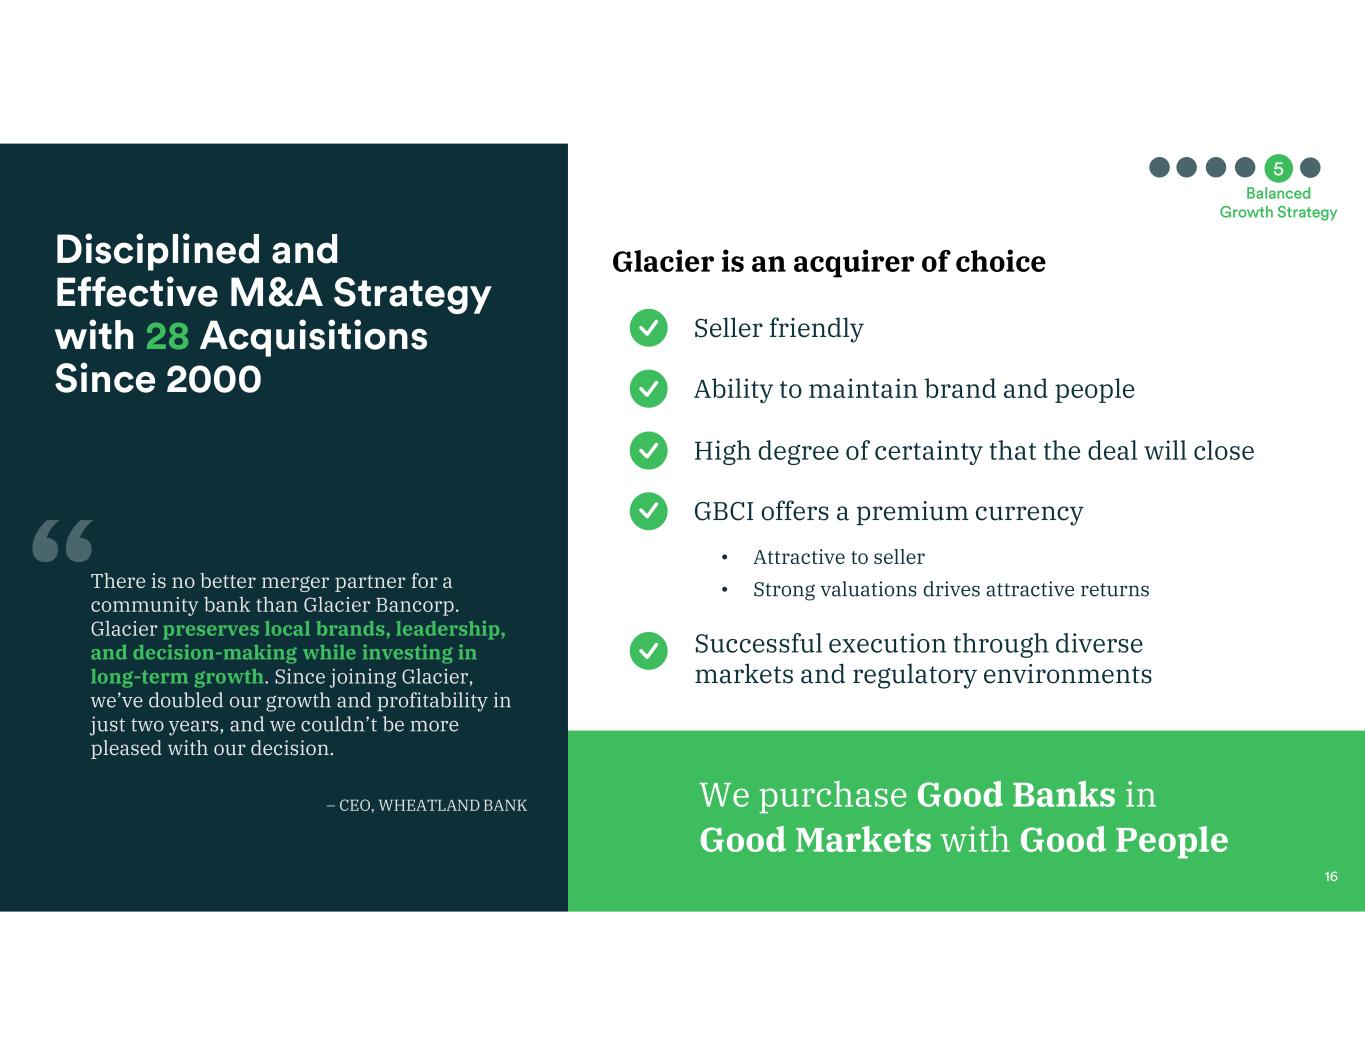
Glacier is an acquirer of choice We purchase Good Banks in Good Markets with Good People Seller friendly • Attractive to seller • Strong valuations drives attractive returns Ability to maintain brand and people High degree of certainty that the deal will close GBCI offers a premium currency Successful execution through diverse markets and regulatory environments There is no better merger partner for a community bank than Glacier Bancorp. Glacier preserves local brands, leadership, and decision-making while investing in long-term growth. Since joining Glacier, we’ve doubled our growth and profitability in just two years, and we couldn’t be more pleased with our decision. – CEO, WHEATLAND BANK
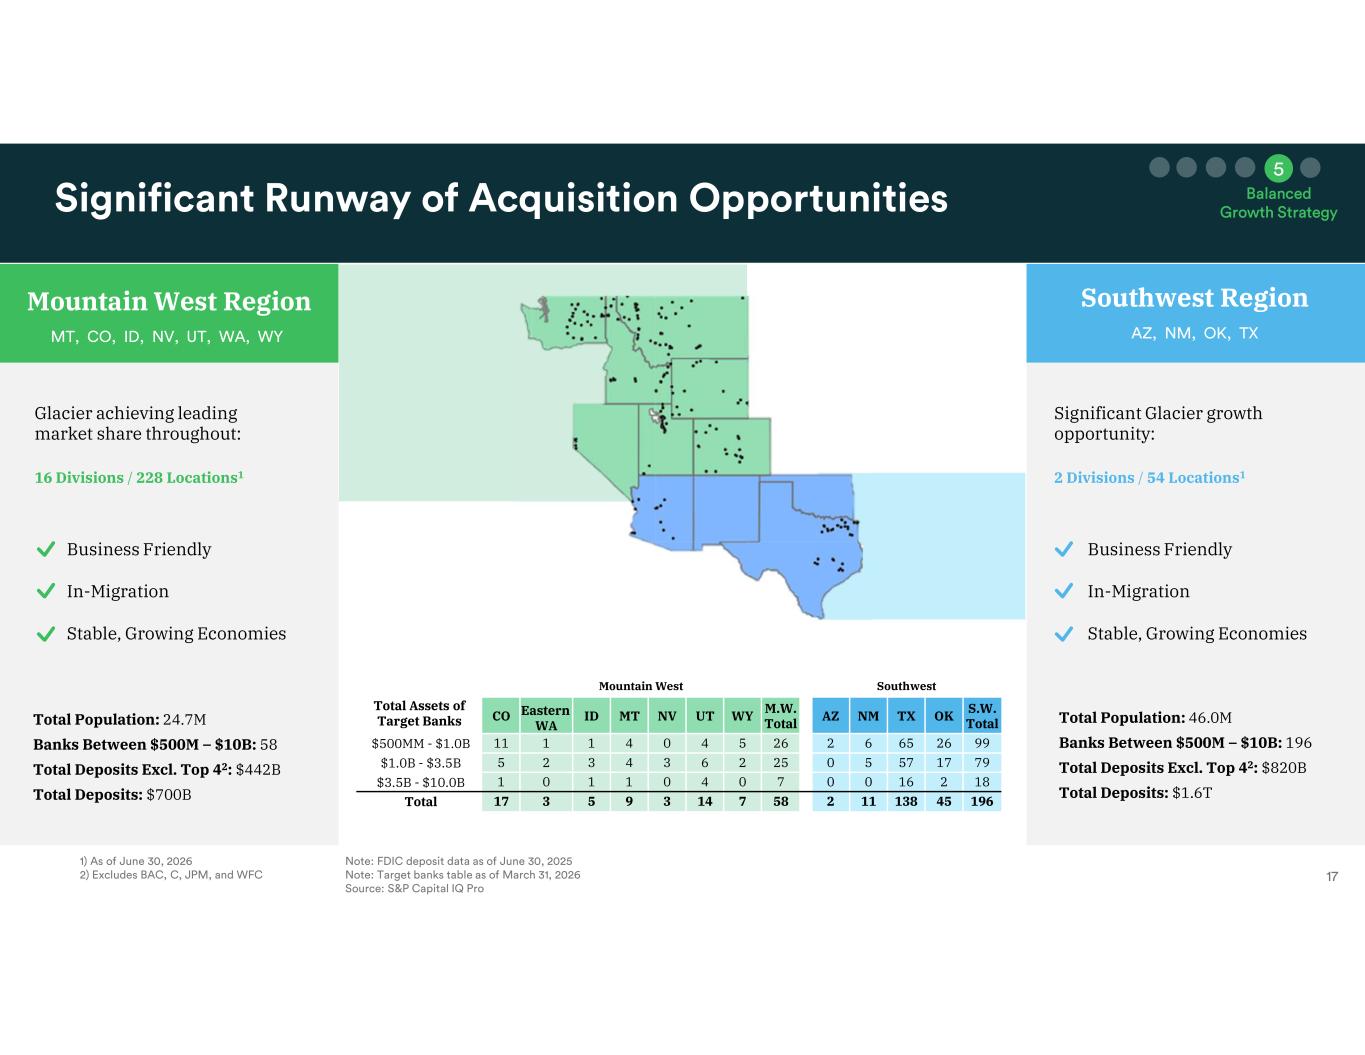
Total Population: 46.0M Banks Between $500M – $10B: 196 Total Deposits Excl. Top 42: $820B Total Deposits: $1.6T Total Population: 24.7M Banks Between $500M – $10B: 58 Total Deposits Excl. Top 42: $442B Total Deposits: $700B SouthwestMountain West Total Assets of Target Banks S.W. TotalOKTXNMAZM.W. TotalWYUTNVMTIDEastern WA CO 992665622654041111$500MM - $1.0B 79175750252634325$1.0B - $3.5B 182160070401101$3.5B - $10.0B 1964513811258714395317Total Southwest Region Glacier achieving leading market share throughout: 16 Divisions / 228 Locations1 Significant Glacier growth opportunity: 2 Divisions / 54 Locations1 Mountain West Region Southwest Region Business Friendly In-Migration Stable, Growing Economies Business Friendly In-Migration Stable, Growing Economies
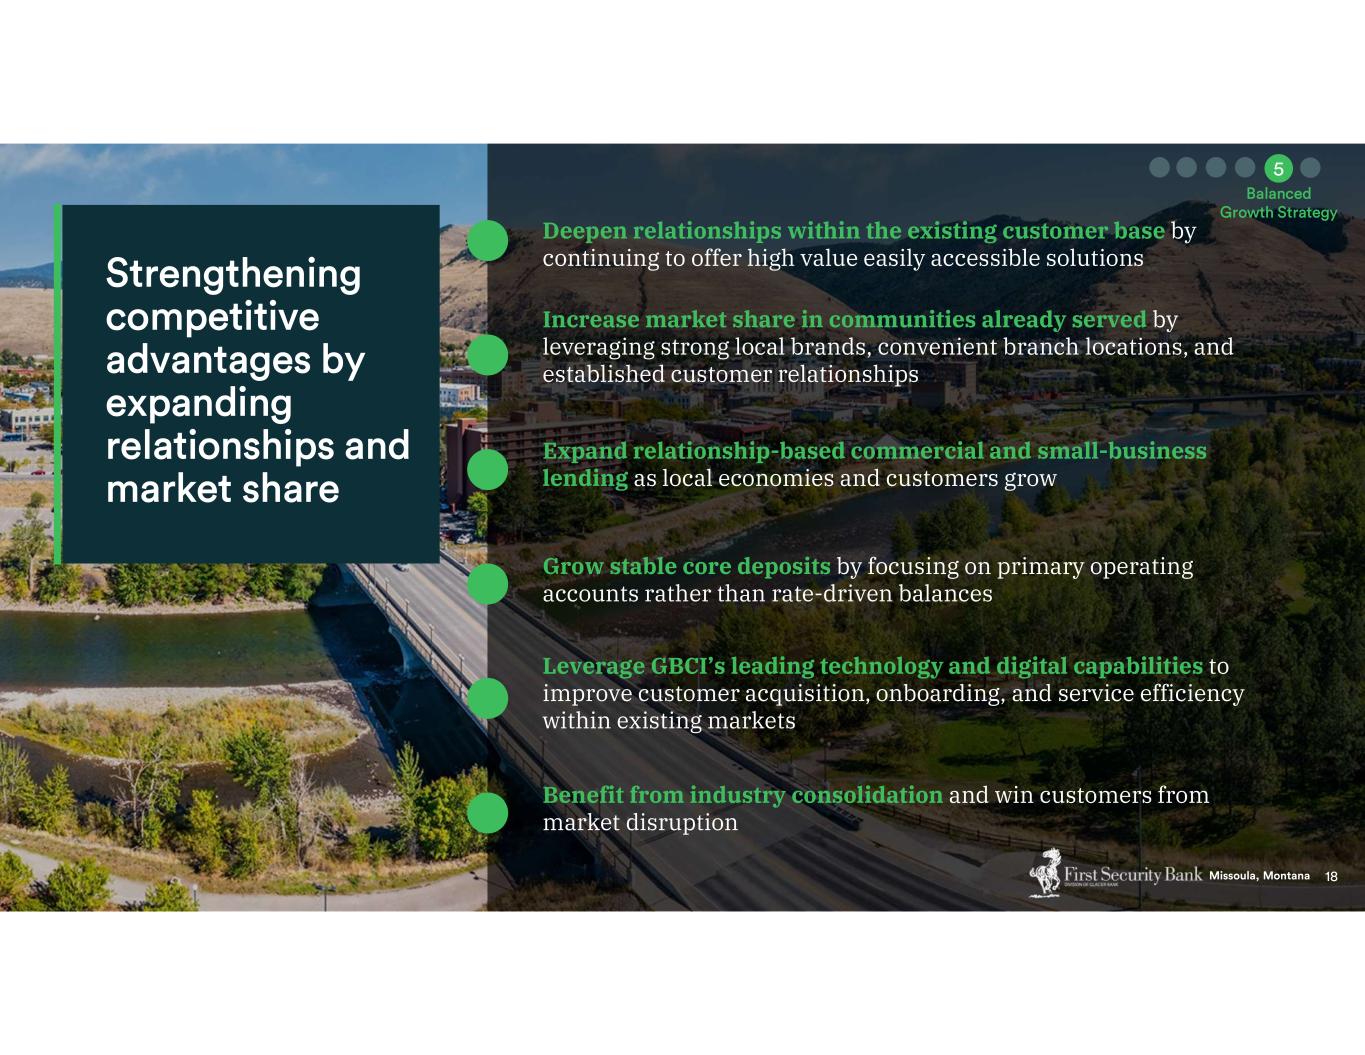
Deepen relationships within the existing customer base by continuing to offer high value easily accessible solutions Increase market share in communities already served by leveraging strong local brands, convenient branch locations, and established customer relationships Expand relationship-based commercial and small-business lending as local economies and customers grow Grow stable core deposits by focusing on primary operating accounts rather than rate-driven balances Leverage GBCI’s leading technology and digital capabilities to improve customer acquisition, onboarding, and service efficiency within existing markets Benefit from industry consolidation and win customers from market disruption
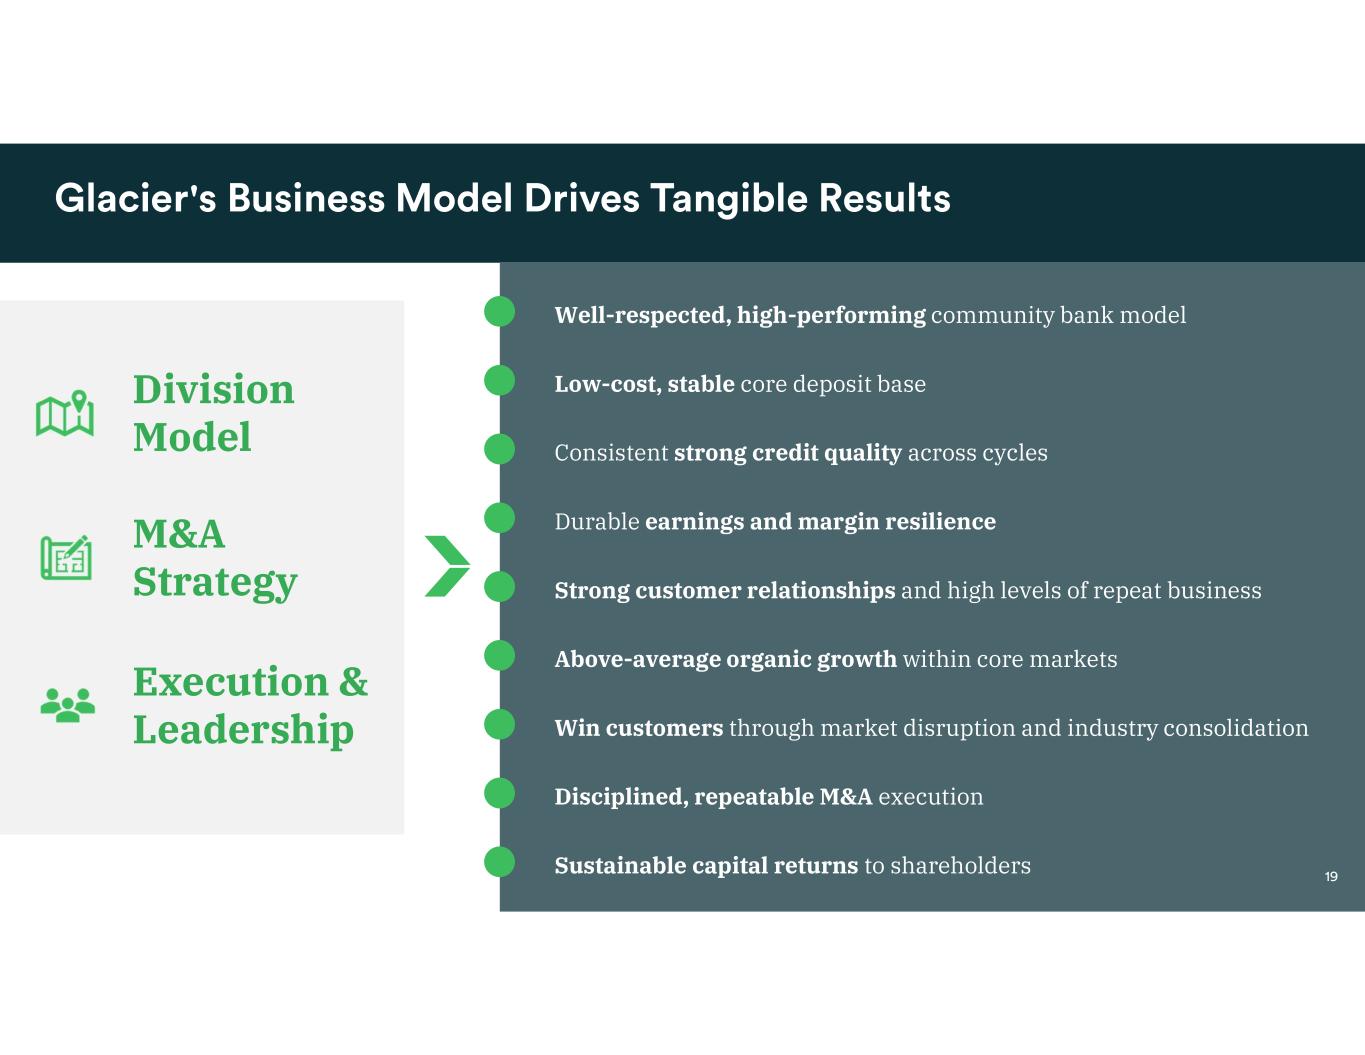
Well-respected, high-performing community bank model Low-cost, stable core deposit base Consistent strong credit quality across cycles Durable earnings and margin resilience Strong customer relationships and high levels of repeat business Above-average organic growth within core markets Win customers through market disruption and industry consolidation Disciplined, repeatable M&A execution Sustainable capital returns to shareholders Division Model M&A Strategy Execution & Leadership
Certain financial measures and ratios the Company presents are supplemental measures that are not required by, or are not presented in accordance with, U.S. generally accepted accounting principles (GAAP). The Company refers to these financial measures and ratios as “non-GAAP financial measures.” A reconciliation of non-GAAP financial measures to the comparable GAAP financial measures is provided within this presentation. The Company considers the use of select non-GAAP financial measures and ratios to be useful for financial and operational decision making and useful in evaluating period-to-period comparisons. The Company believes that these non-GAAP financial measures provide meaningful supplemental information regarding the Company’s performance by excluding certain income or intangible items that the Company believes are not indicative of its primary business operating results. These non-GAAP financial measures should not be considered a substitute for financial information presented in accordance with GAAP and investors should not rely on non-GAAP financial measures alone as measures of our performance. The non-GAAP financial measures presented may differ from non-GAAP financial measures used by the Company’s peers or other companies. The Company compensates for these differences by providing the equivalent GAAP measures whenever the Company presents the non-GAAP financial measures and by including a reconciliation of the impact of the components adjusted for in the non-GAAP financial measure so that both measures and the individual components may be considered when analyzing our performance.
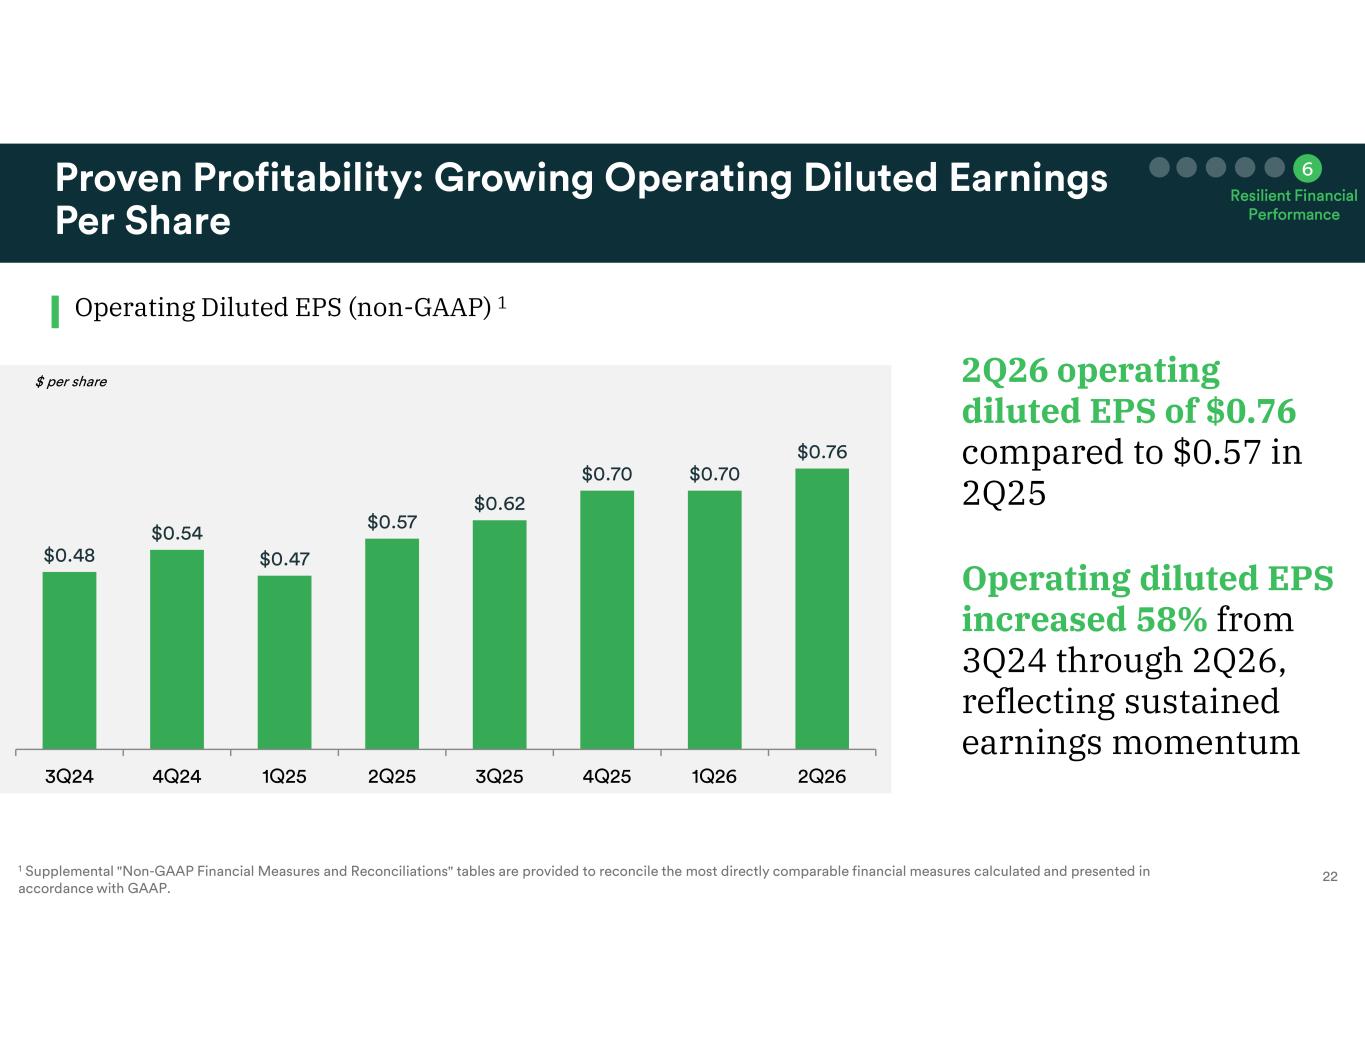
Operating Diluted EPS (non-GAAP) 1 2Q26 operating diluted EPS of $0.76 compared to $0.57 in 2Q25 Operating diluted EPS increased 58% from 3Q24 through 2Q26, reflecting sustained earnings momentum
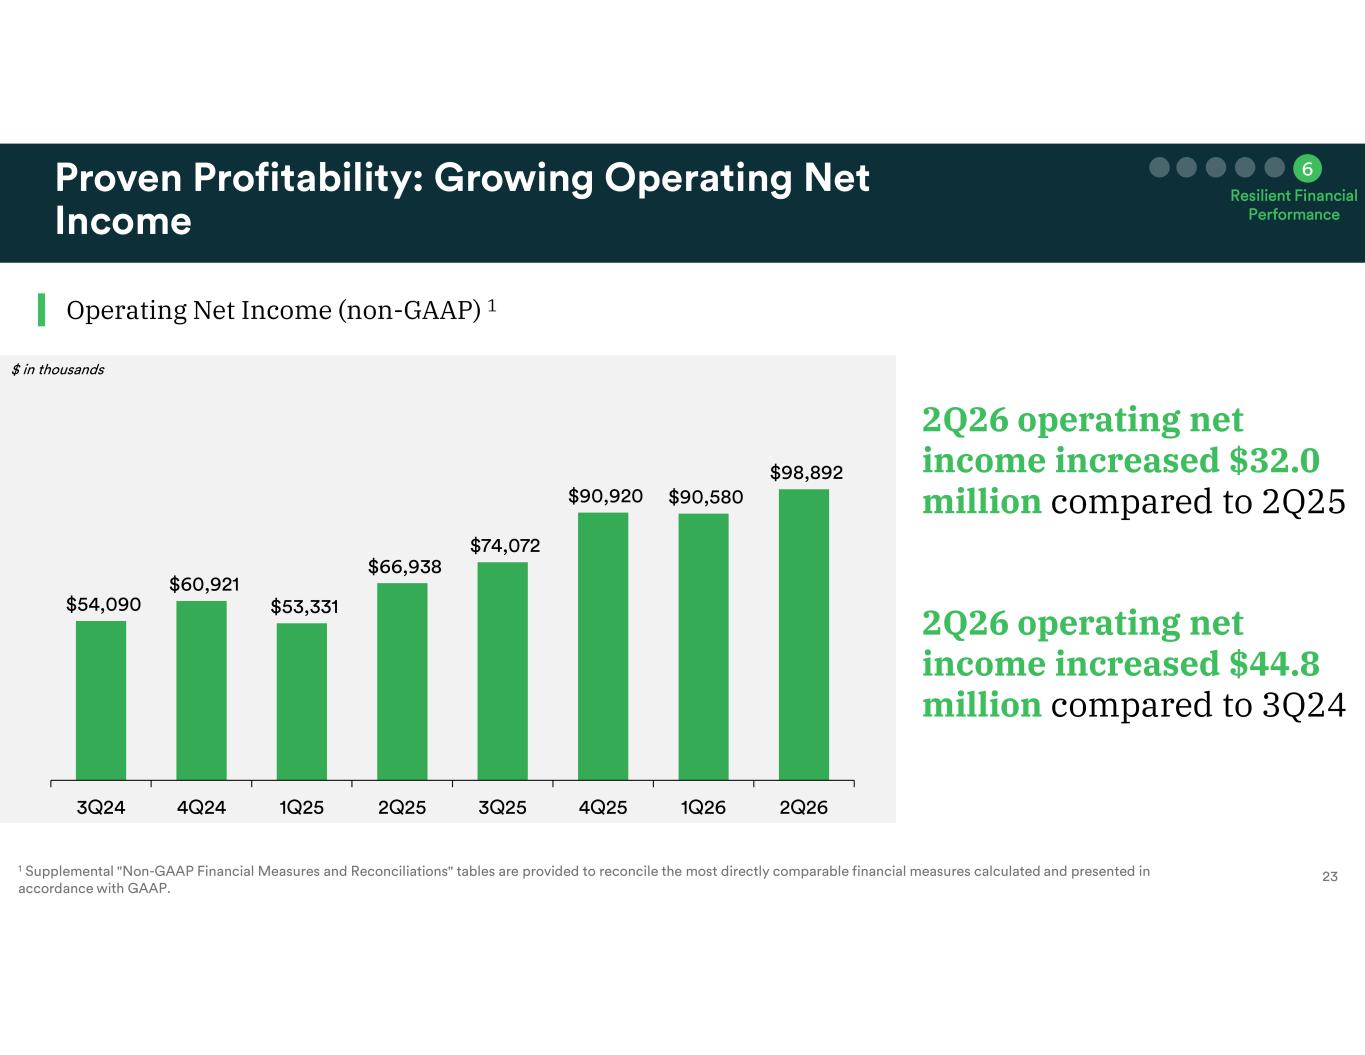
2Q26 operating net income increased $32.0 million compared to 2Q25 Operating Net Income (non-GAAP) 1 2Q26 operating net income increased $44.8 million compared to 3Q24
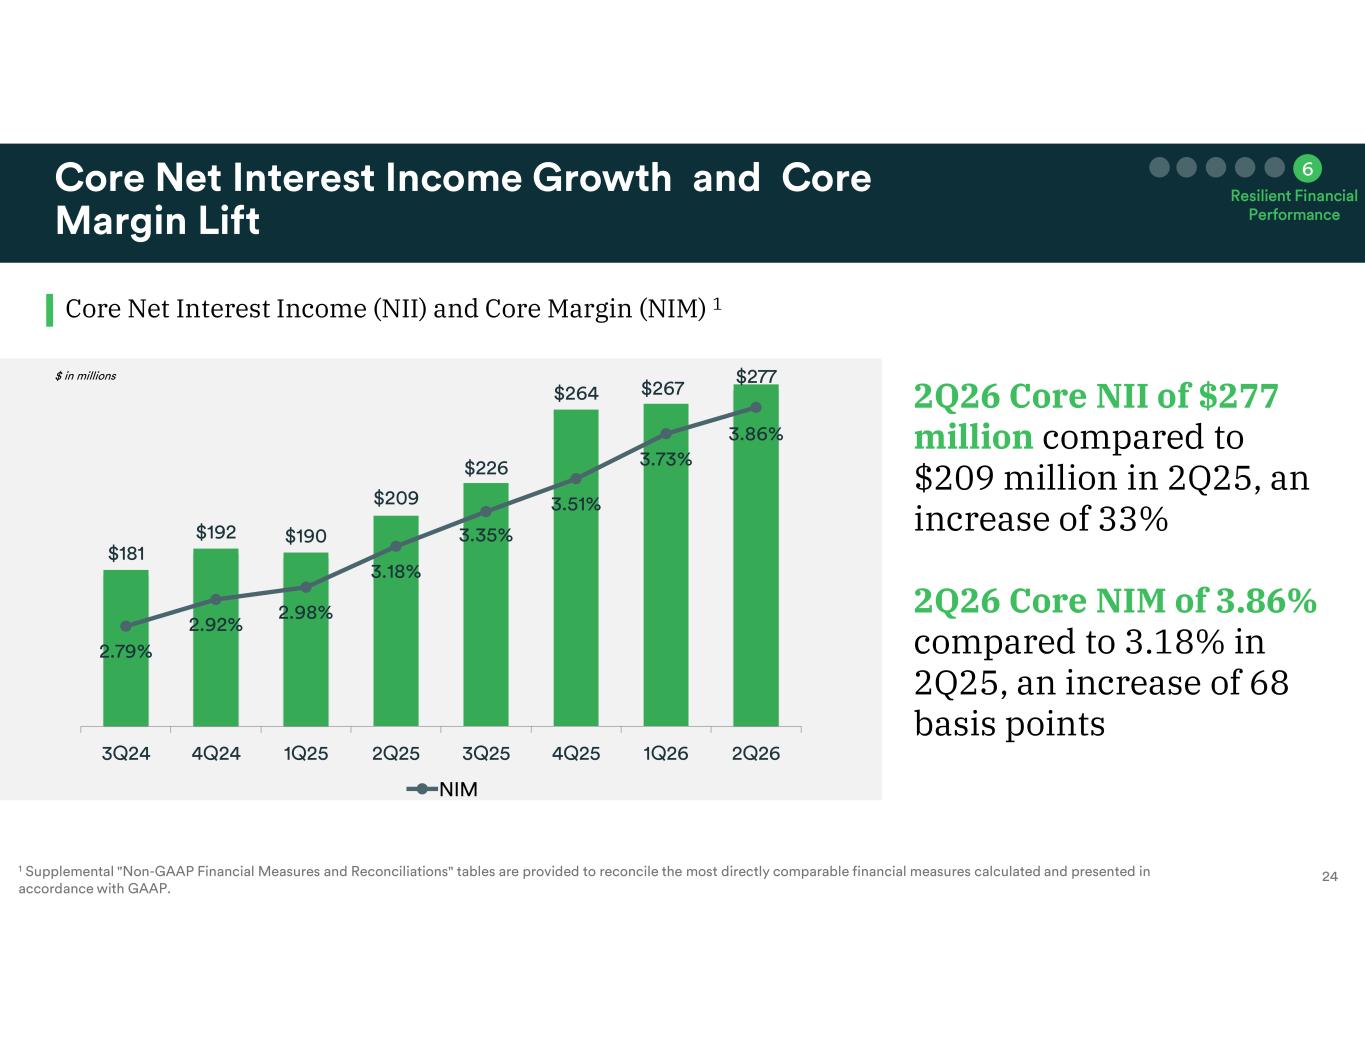
2Q26 Core NII of $277 million compared to $209 million in 2Q25, an increase of 33% 2Q26 Core NIM of 3.86% compared to 3.18% in 2Q25, an increase of 68 basis points Core Net Interest Income (NII) and Core Margin (NIM) 1
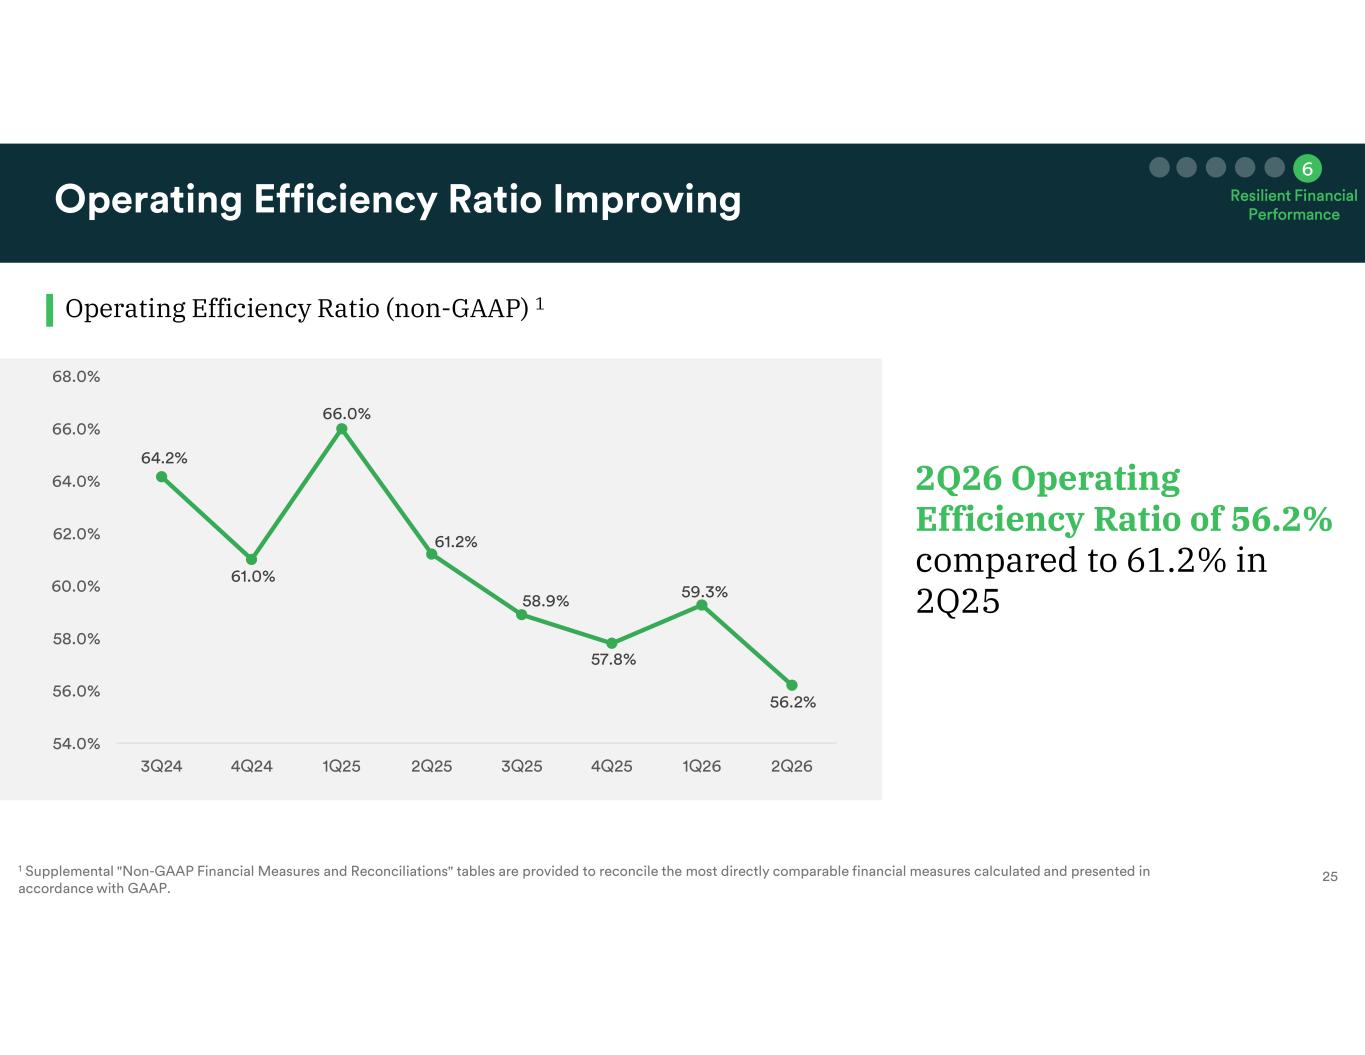
2Q26 Operating Efficiency Ratio of 56.2% compared to 61.2% in 2Q25 Operating Efficiency Ratio (non-GAAP) 1
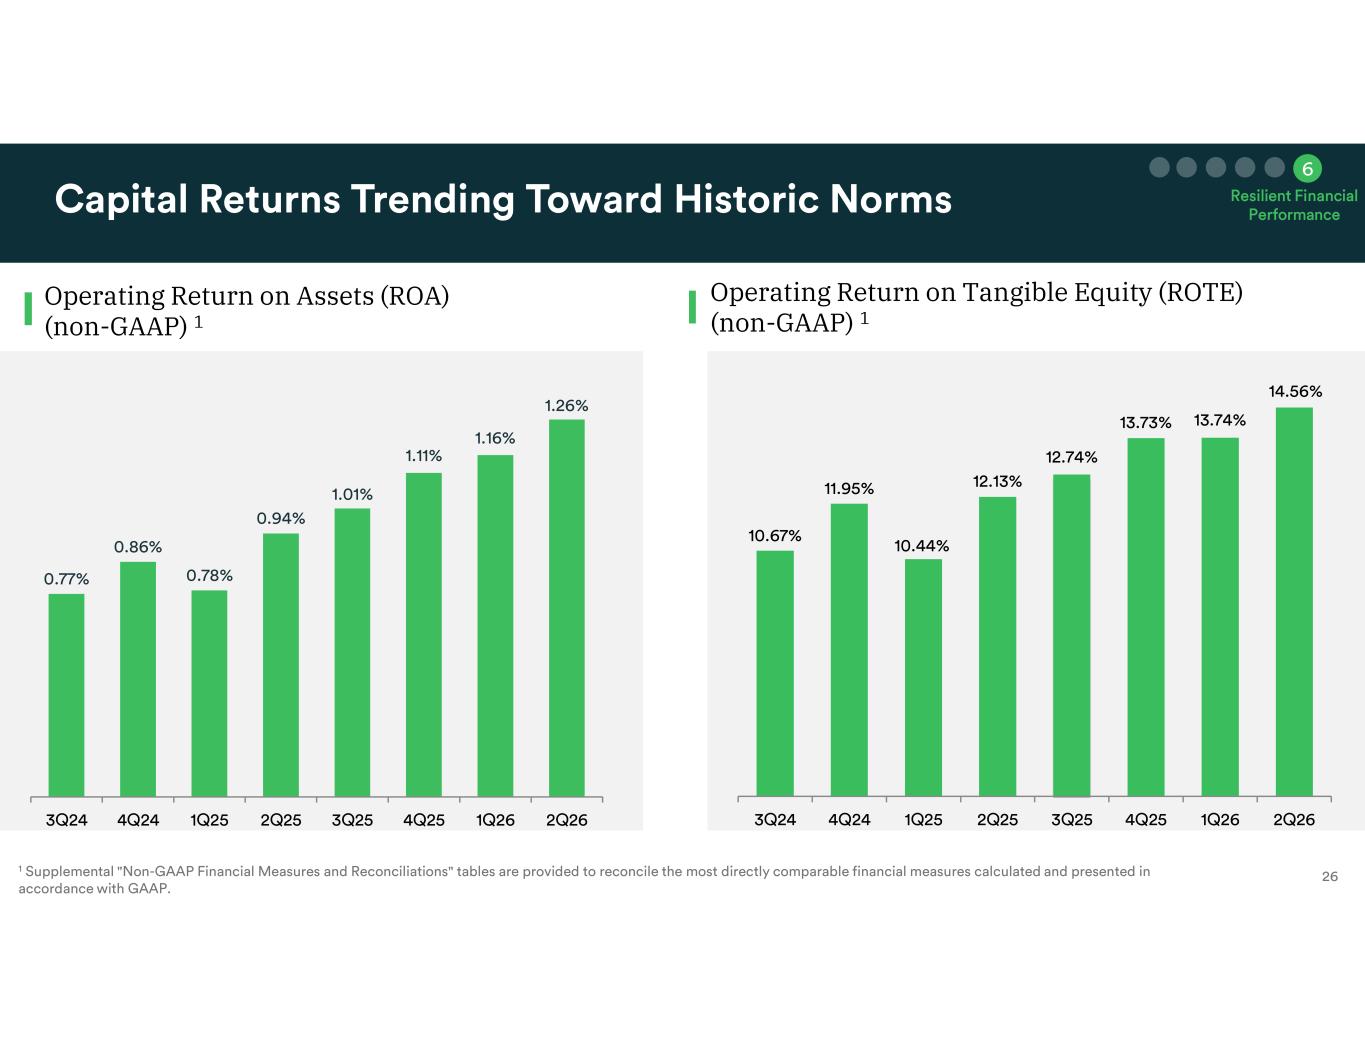
Operating Return on Assets (ROA) (non-GAAP) 1 Operating Return on Tangible Equity (ROTE) (non-GAAP) 1
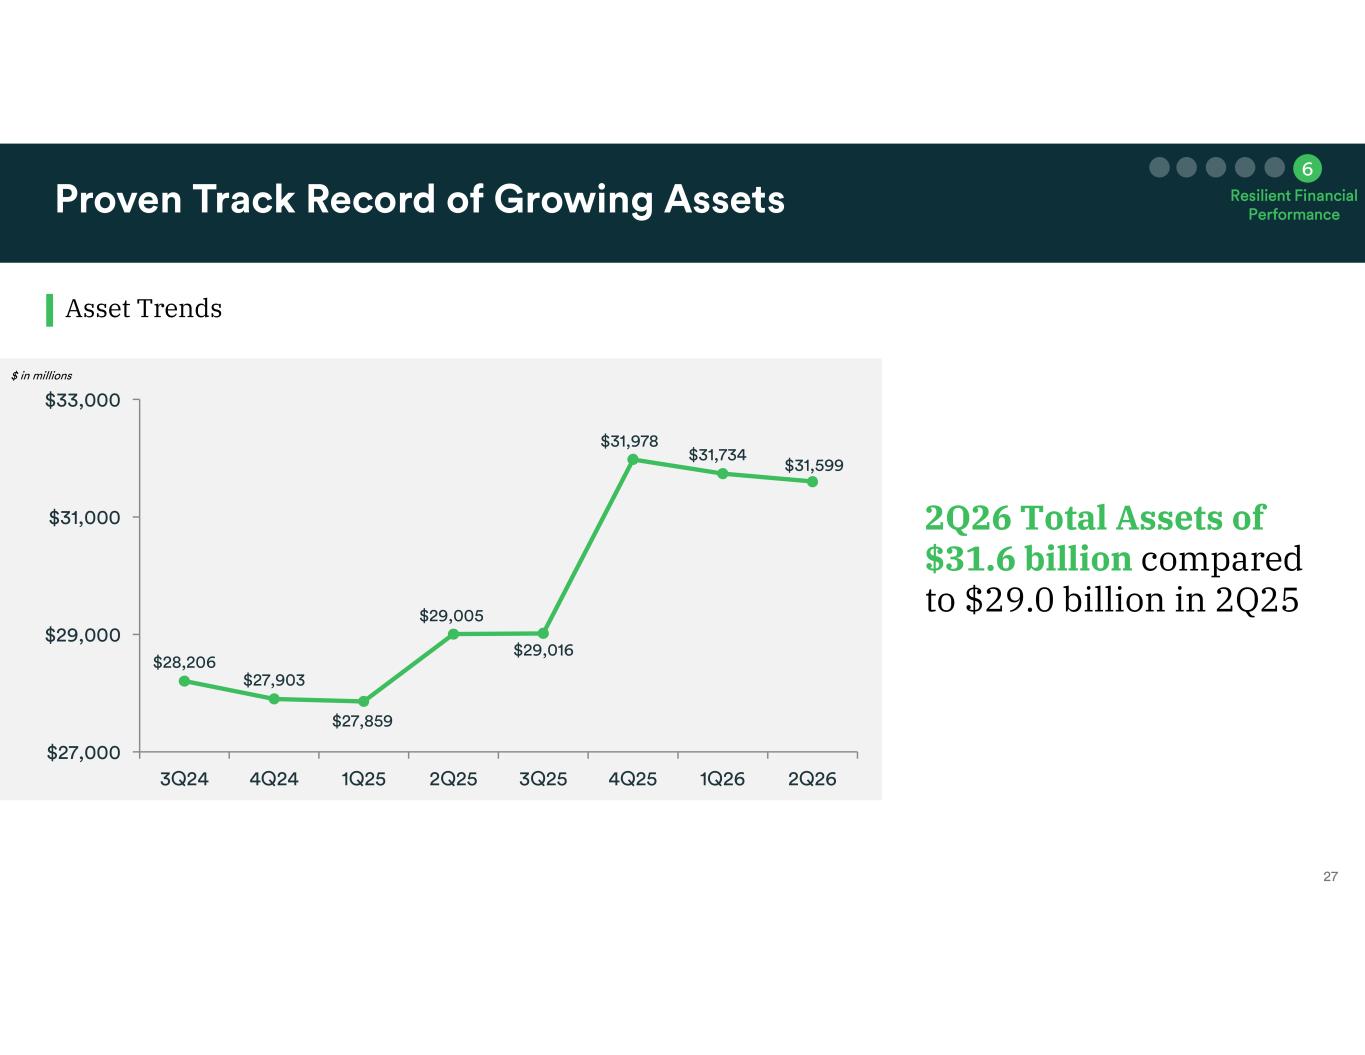
Asset Trends 2Q26 Total Assets of $31.6 billion compared to $29.0 billion in 2Q25
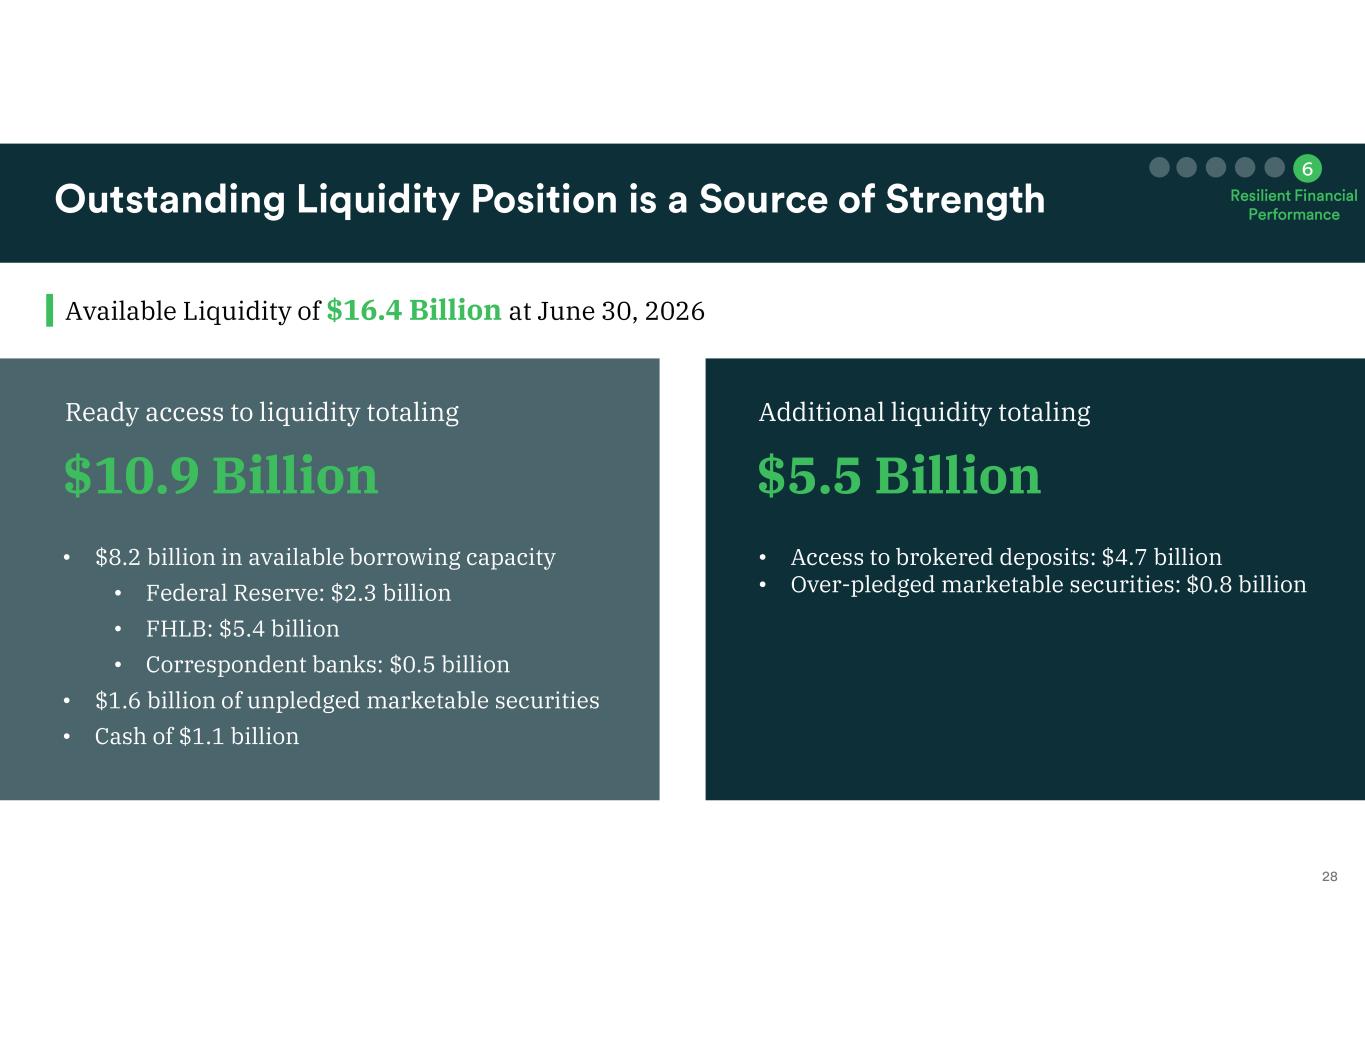
Available Liquidity of $16.4 Billion at June 30, 2026 $10.9 Billion • $8.2 billion in available borrowing capacity • Federal Reserve: $2.3 billion • FHLB: $5.4 billion • Correspondent banks: $0.5 billion • $1.6 billion of unpledged marketable securities • Cash of $1.1 billion • Access to brokered deposits: $4.7 billion • Over-pledged marketable securities: $0.8 billion Ready access to liquidity totaling $5.5 Billion Additional liquidity totaling
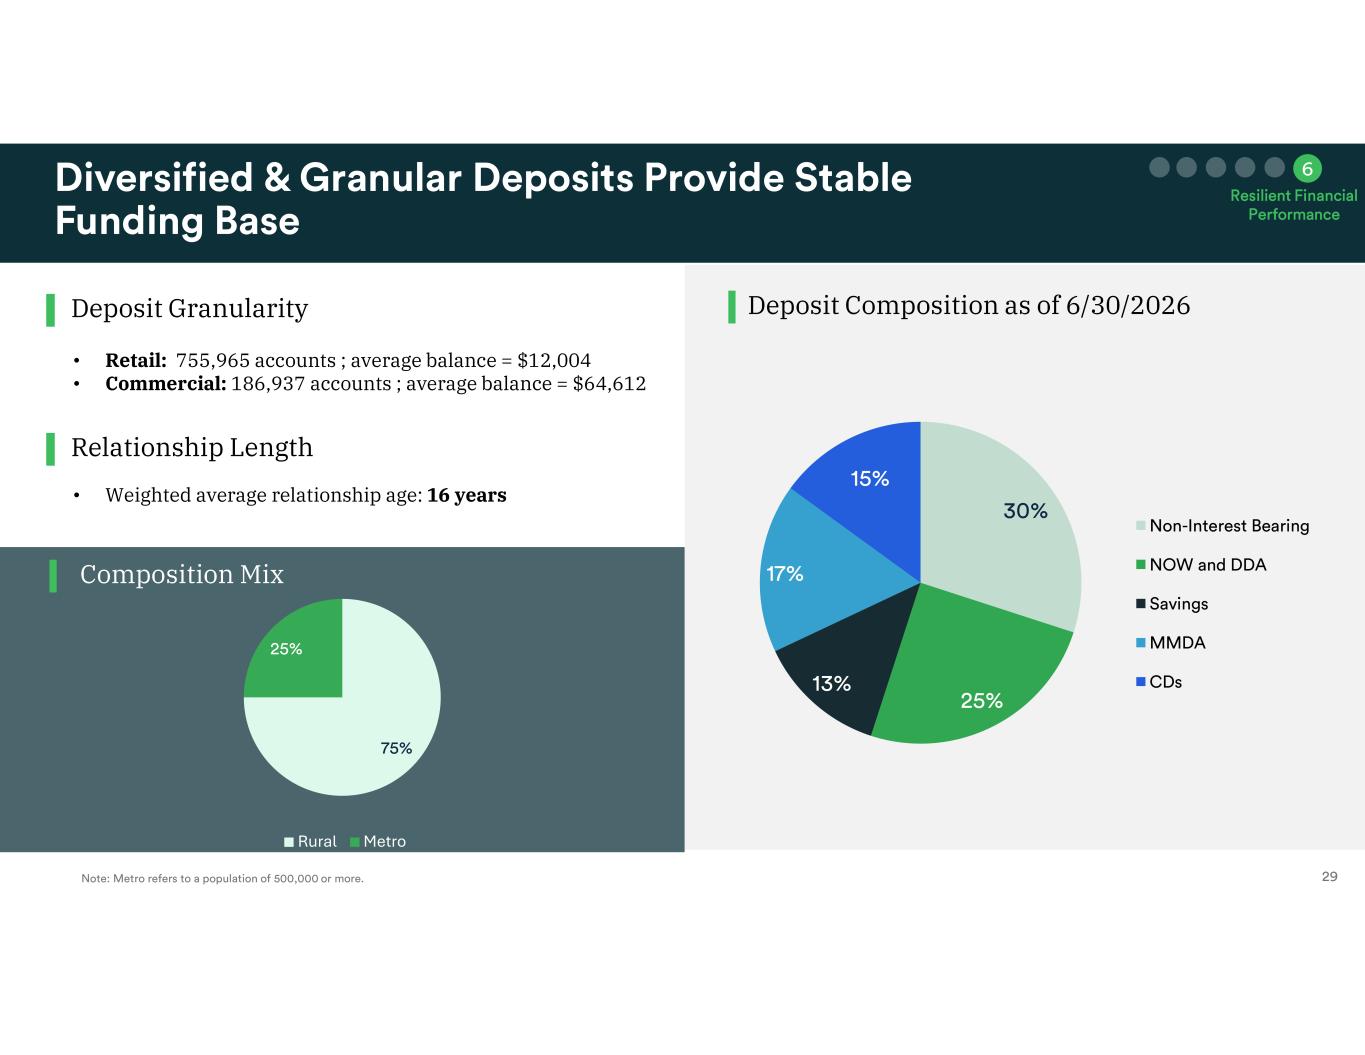
Deposit Composition as of 6/30/2026Deposit Granularity Composition Mix Relationship Length • Retail: 755,965 accounts ; average balance = $12,004 • Commercial: 186,937 accounts ; average balance = $64,612 • Weighted average relationship age: 16 years Rural Metro
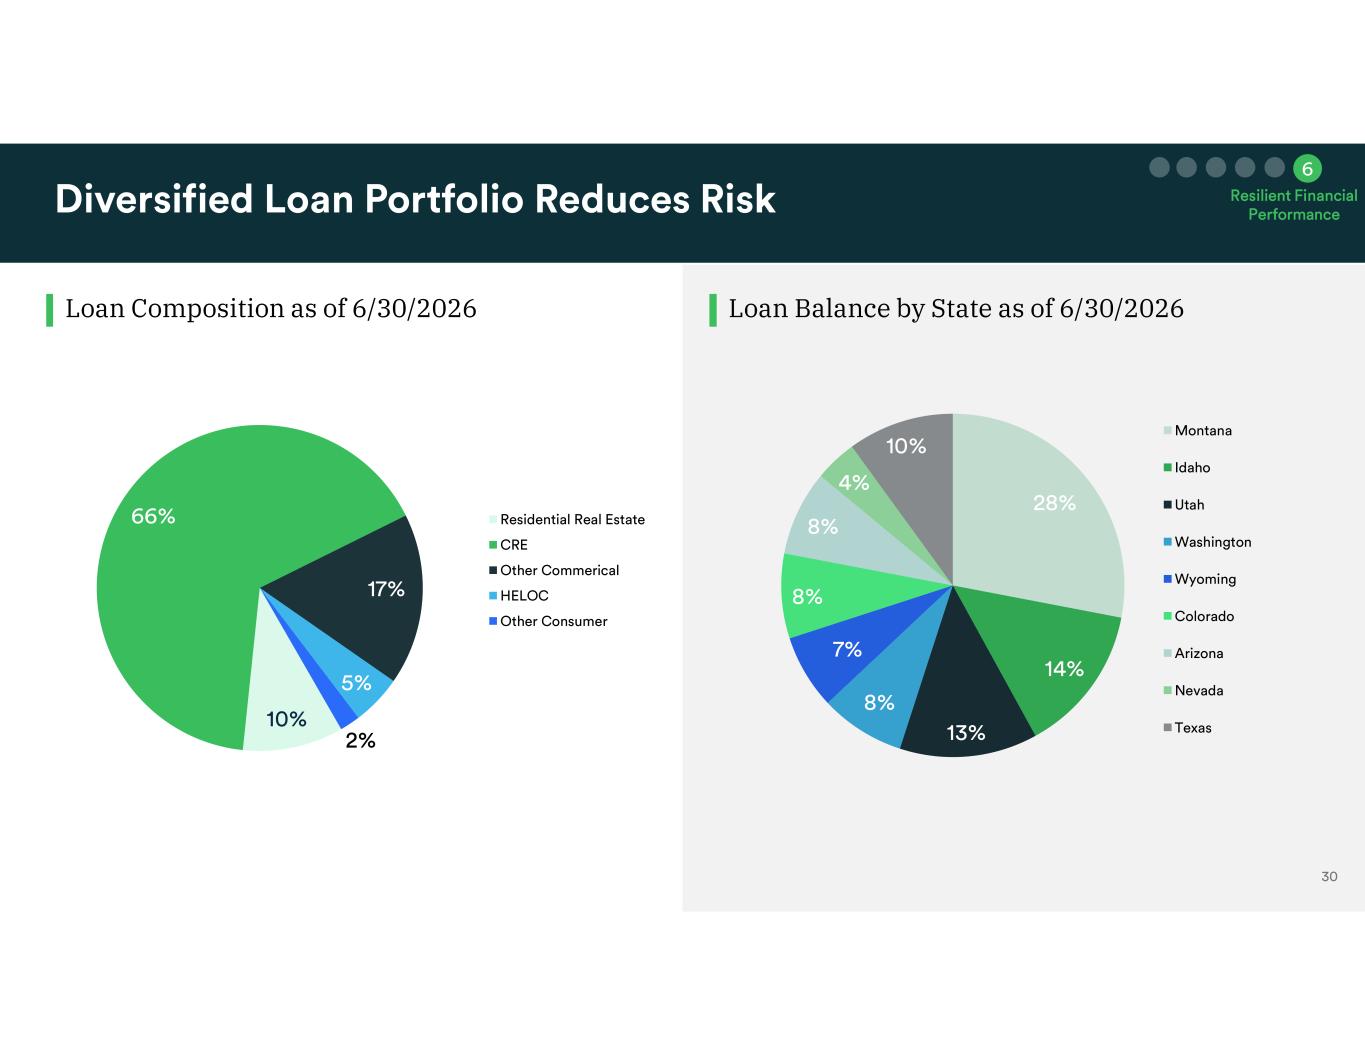
Loan Composition as of 6/30/2026 Loan Balance by State as of 6/30/2026
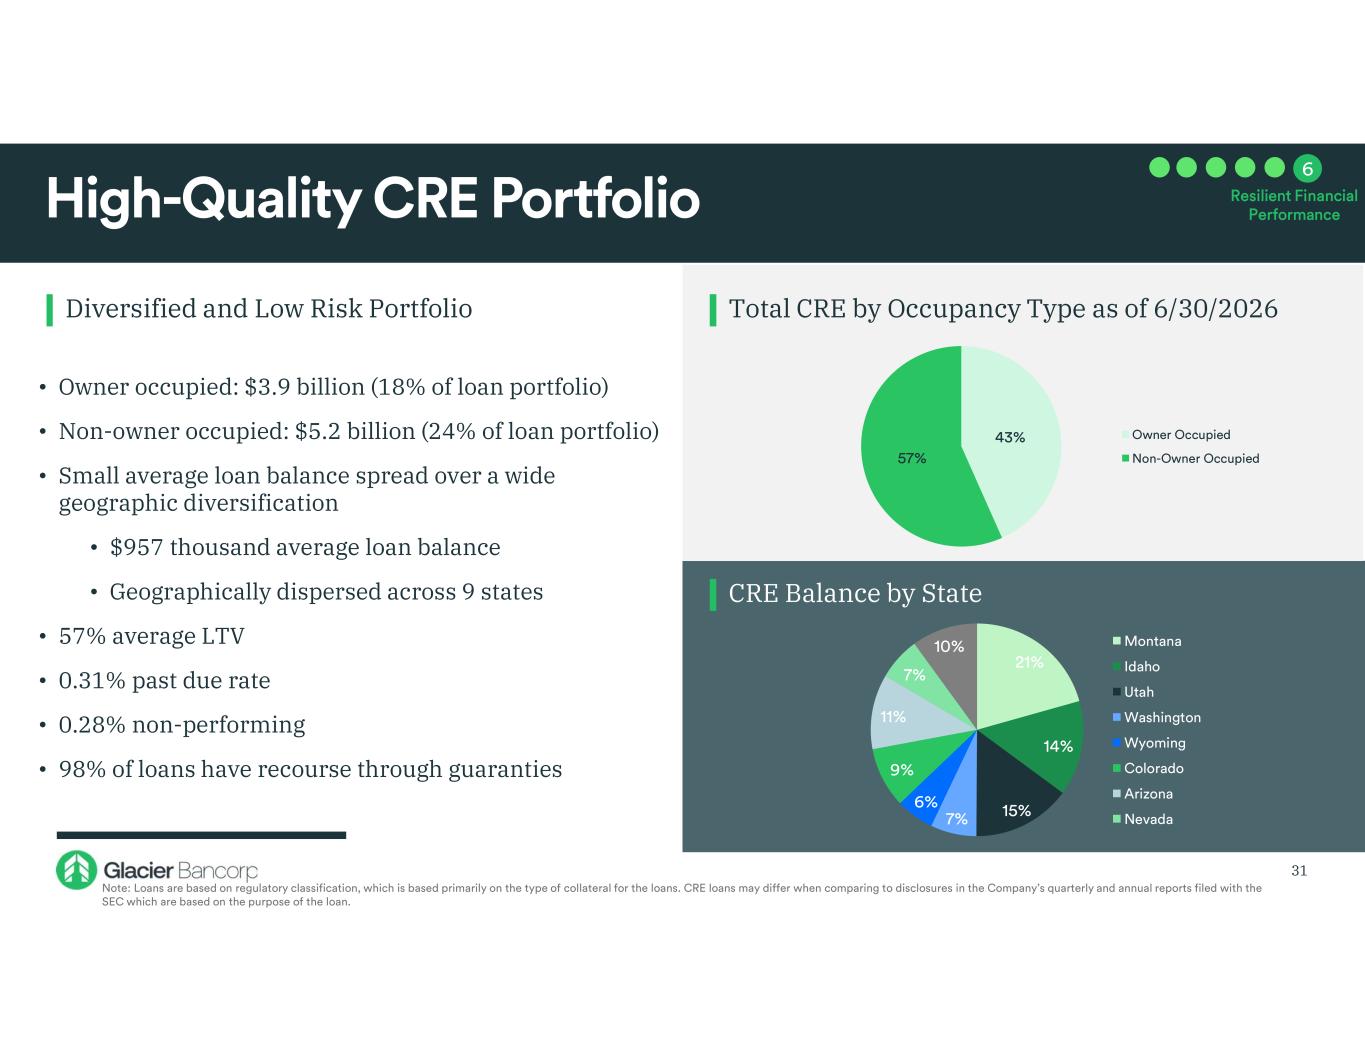
Diversified and Low Risk Portfolio Total CRE by Occupancy Type as of 6/30/2026 CRE Balance by State • Owner occupied: $3.9 billion (18% of loan portfolio) • Non-owner occupied: $5.2 billion (24% of loan portfolio) • Small average loan balance spread over a wide geographic diversification • $957 thousand average loan balance • Geographically dispersed across 9 states • 57% average LTV • 0.31% past due rate • 0.28% non-performing • 98% of loans have recourse through guaranties 31
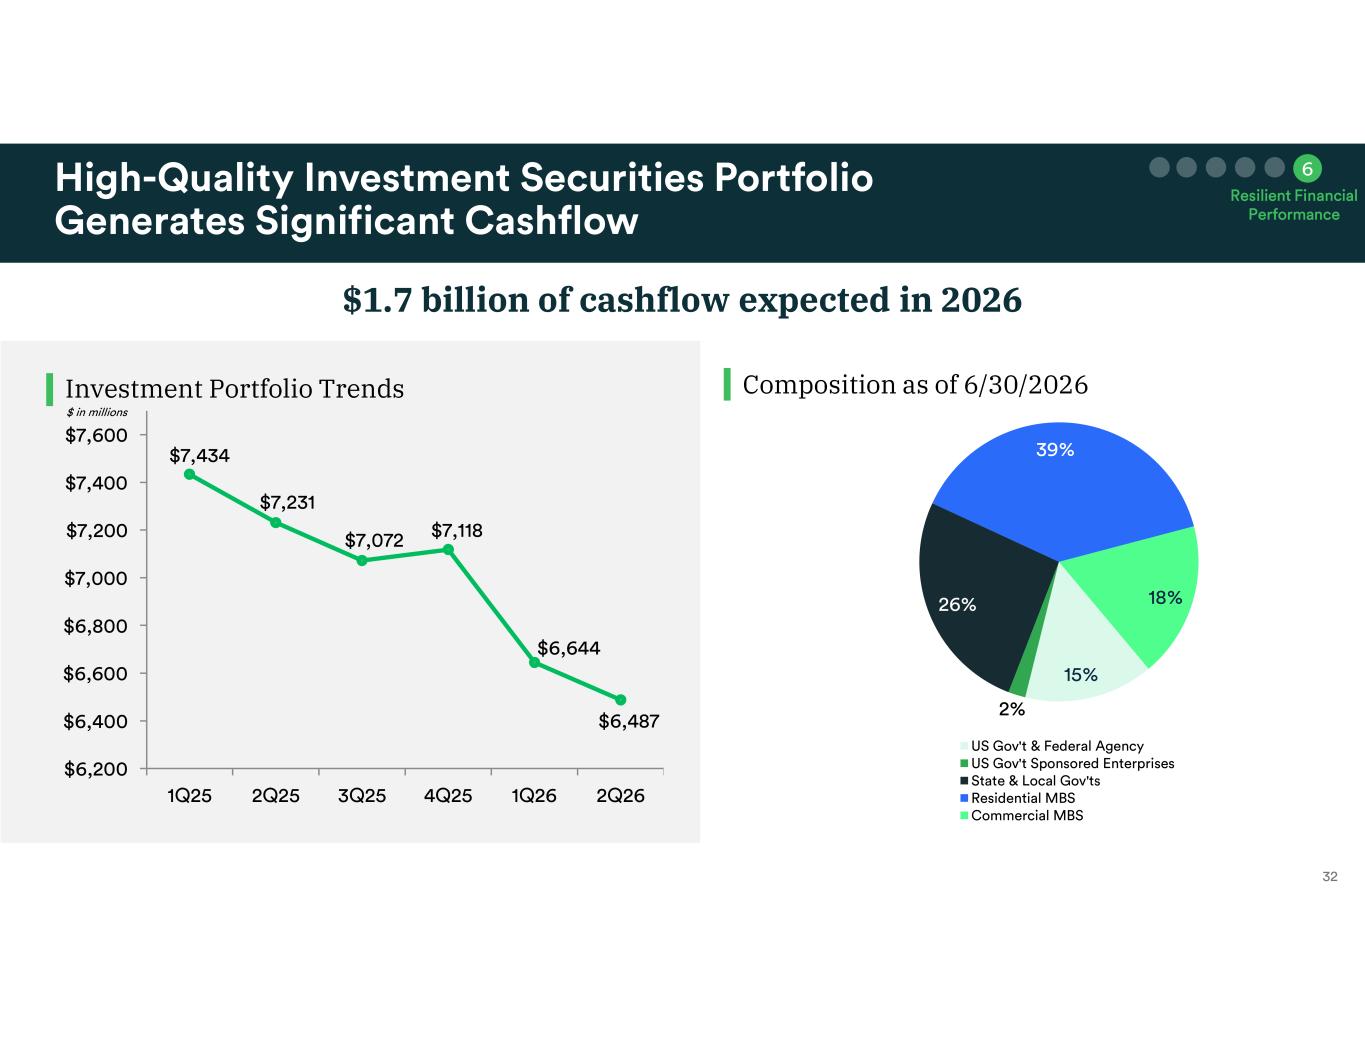
Investment Portfolio Trends $1.7 billion of cashflow expected in 2026 Composition as of 6/30/2026
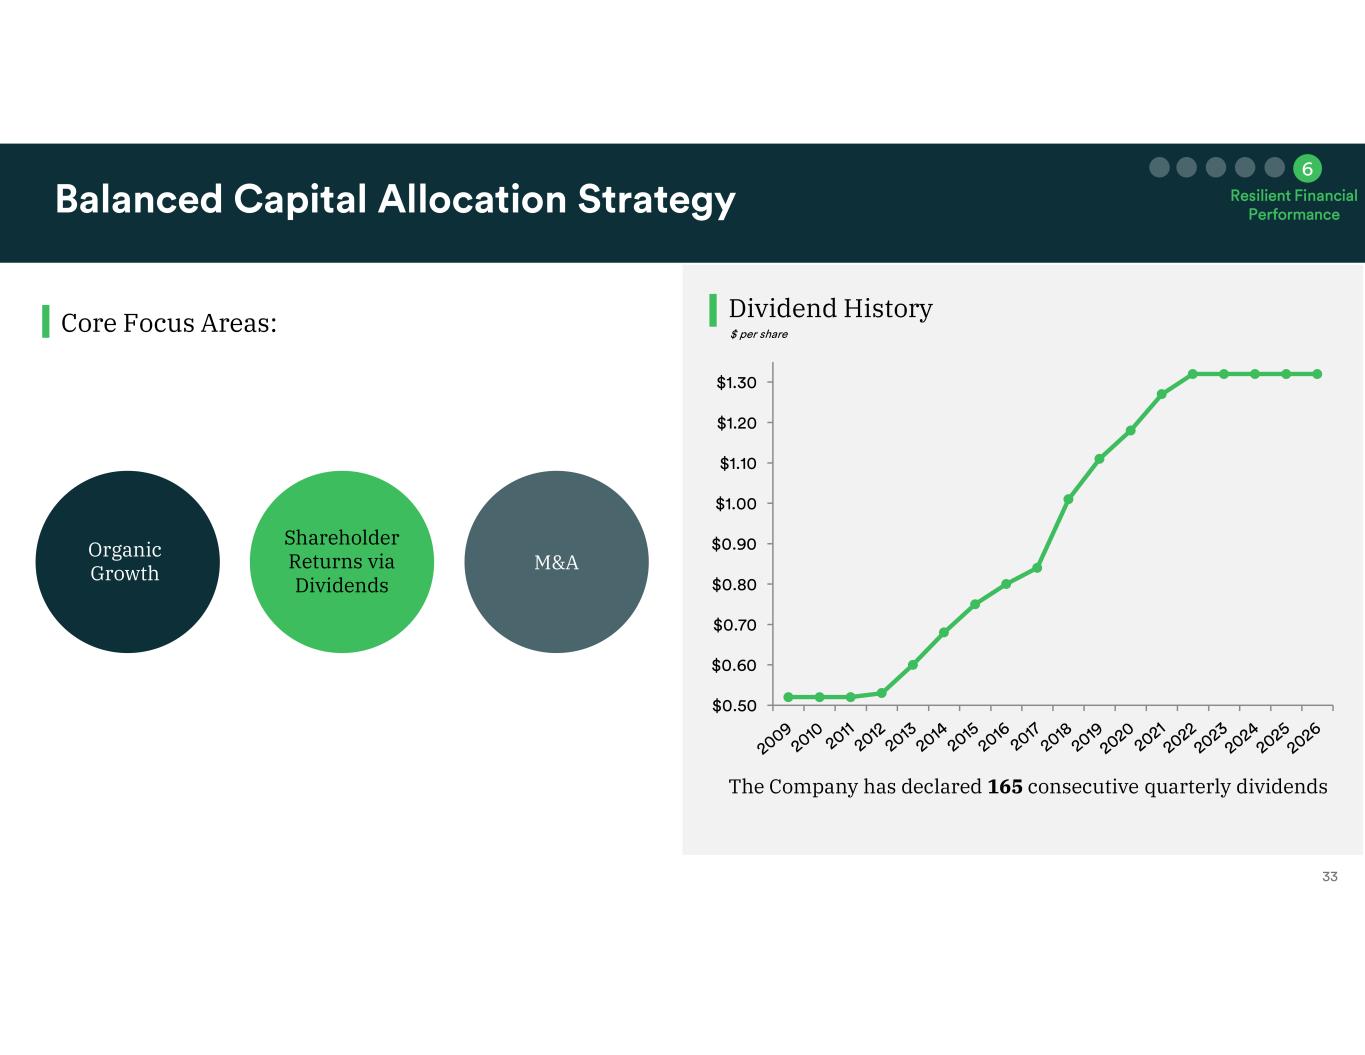
Dividend HistoryCore Focus Areas: M&A Shareholder Returns via Dividends Organic Growth The Company has declared 165 consecutive quarterly dividends
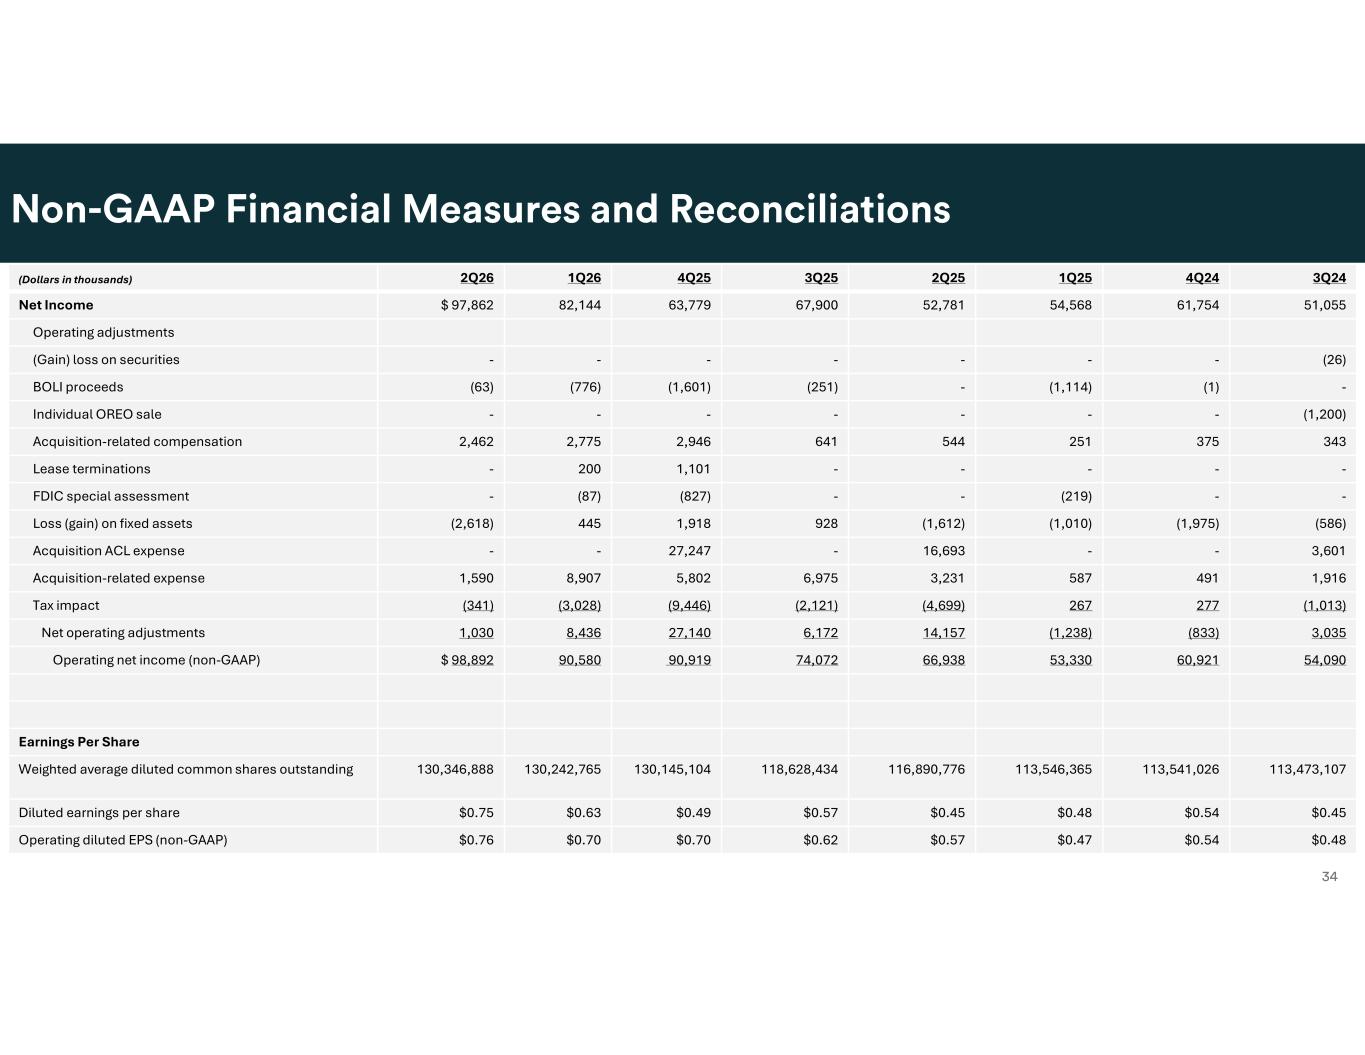
. 3Q244Q241Q252Q253Q254Q251Q262Q26(Dollars in thousands) 51,05561,75454,56852,78167,90063,77982,144$ 97,862Net Income Operating adjustments (26)-------(Gain) loss on securities -(1)(1,114)-(251)(1,601)(776)(63)BOLI proceeds (1,200)-------Individual OREO sale 3433752515446412,9462,7752,462Acquisition-related compensation -----1,101200-Lease terminations --(219)--(827)(87)-FDIC special assessment (586)(1,975)(1,010)(1,612)9281,918445(2,618)Loss (gain) on fixed assets 3,601--16,693-27,247--Acquisition ACL expense 1,9164915873,2316,9755,8028,9071,590Acquisition-related expense (1,013)277267(4,699)(2,121)(9,446)(3,028)(341)Tax impact 3,035(833)(1,238)14,1576,17227,1408,4361,030Net operating adjustments 54,09060,92153,33066,93874,07290,91990,580$ 98,892Operating net income (non-GAAP) Earnings Per Share 113,473,107113,541,026113,546,365116,890,776118,628,434130,145,104130,242,765130,346,888Weighted average diluted common shares outstanding $0.45$0.54$0.48$0.45$0.57$0.49$0.63$0.75Diluted earnings per share $0.48$0.54$0.47$0.57$0.62$0.70$0.70$0.76Operating diluted EPS (non-GAAP)
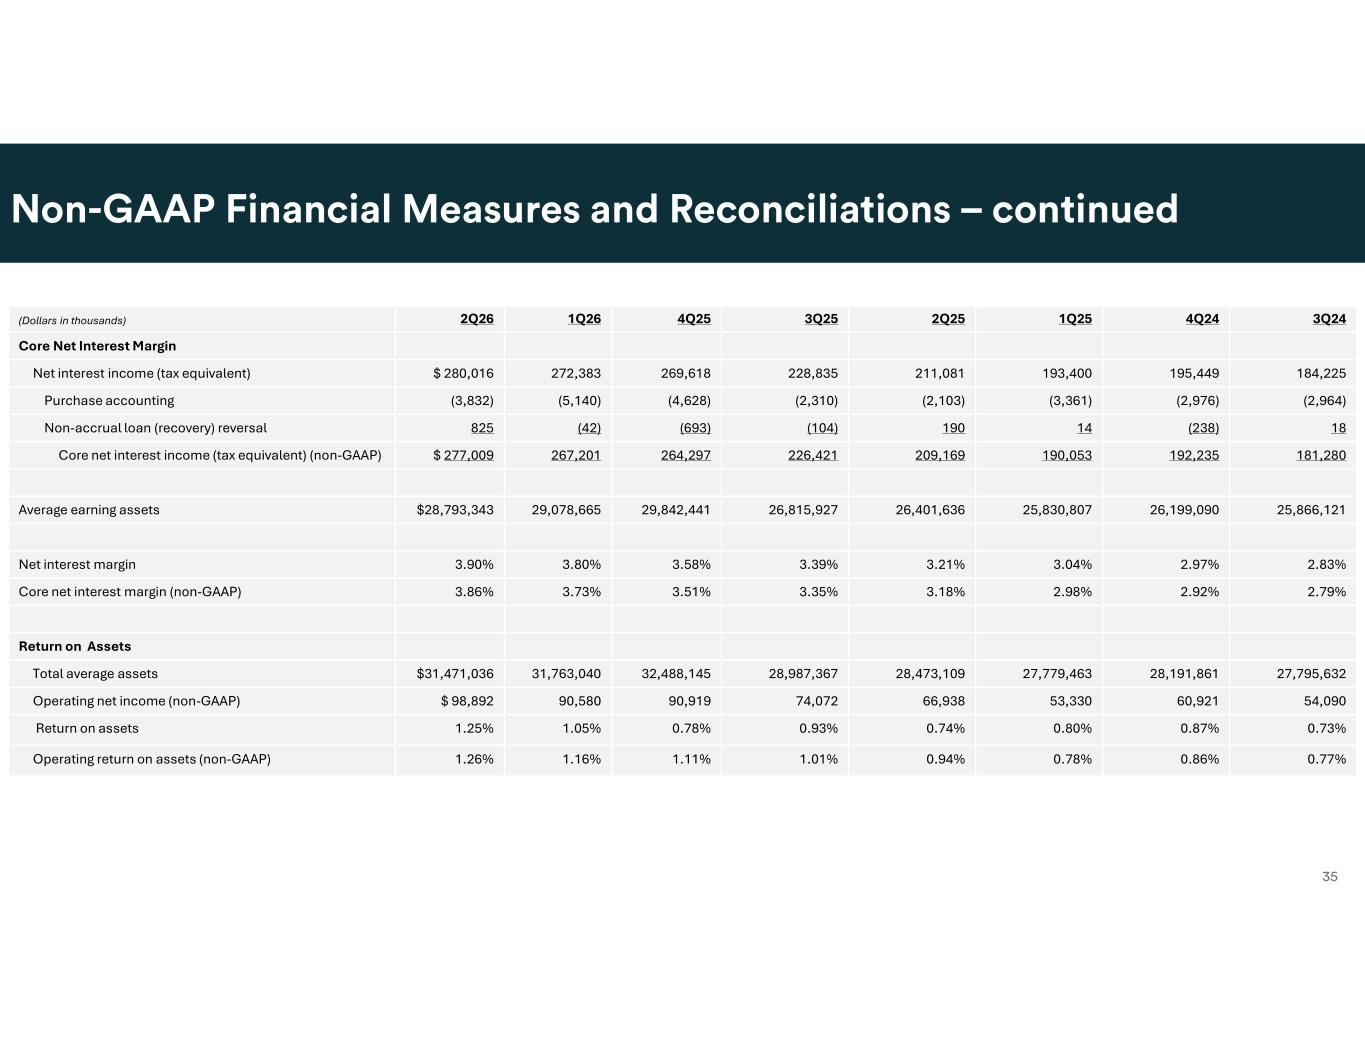
. 3Q244Q241Q252Q253Q254Q251Q262Q26(Dollars in thousands) Core Net Interest Margin 184,225195,449193,400211,081228,835269,618272,383$ 280,016Net interest income (tax equivalent) (2,964)(2,976)(3,361)(2,103)(2,310)(4,628)(5,140)(3,832)Purchase accounting 18(238)14190(104)(693)(42)825Non-accrual loan (recovery) reversal 181,280192,235190,053209,169226,421264,297267,201$ 277,009Core net interest income (tax equivalent) (non-GAAP) 25,866,12126,199,09025,830,80726,401,63626,815,92729,842,44129,078,665$28,793,343Average earning assets 2.83%2.97%3.04%3.21%3.39%3.58%3.80%3.90%Net interest margin 2.79%2.92%2.98%3.18%3.35%3.51%3.73%3.86%Core net interest margin (non-GAAP) Return on Assets 27,795,63228,191,86127,779,46328,473,10928,987,36732,488,14531,763,040$31,471,036Total average assets 54,09060,92153,33066,93874,07290,91990,580$ 98,892Operating net income (non-GAAP) 0.73%0.87%0.80%0.74%0.93%0.78%1.05%1.25%Return on assets 0.77%0.86%0.78%0.94%1.01%1.11%1.16%1.26%Operating return on assets (non-GAAP)
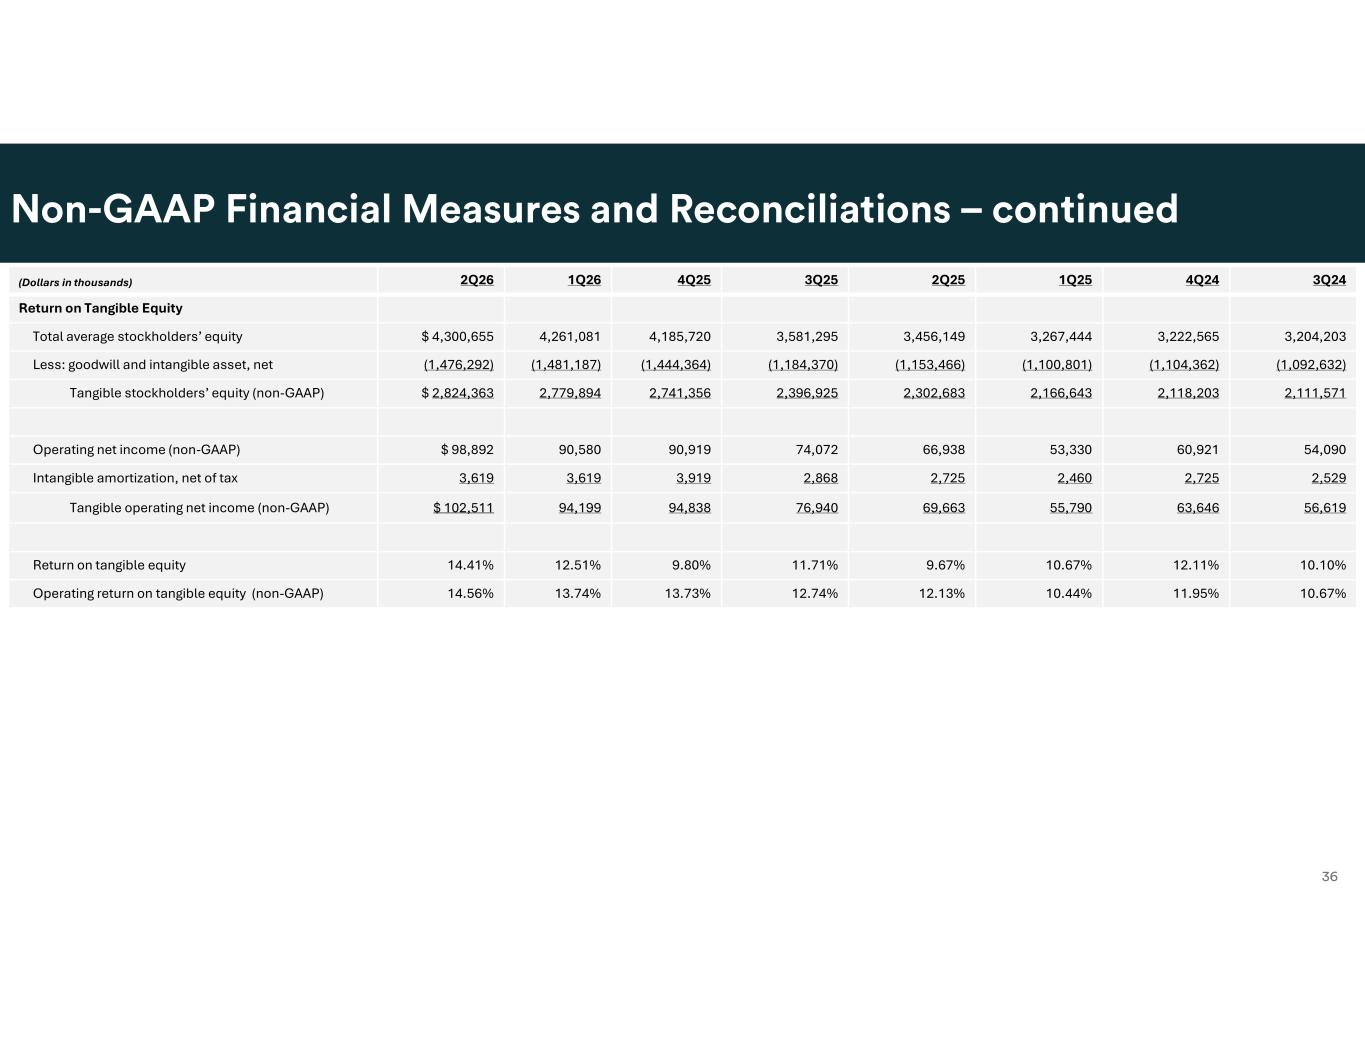
. 3Q244Q241Q252Q253Q254Q251Q262Q26(Dollars in thousands) Return on Tangible Equity 3,204,2033,222,5653,267,4443,456,1493,581,2954,185,7204,261,081$ 4,300,655Total average stockholders’ equity (1,092,632)(1,104,362)(1,100,801)(1,153,466)(1,184,370)(1,444,364)(1,481,187)(1,476,292)Less: goodwill and intangible asset, net 2,111,5712,118,2032,166,6432,302,6832,396,9252,741,3562,779,894$ 2,824,363Tangible stockholders’ equity (non-GAAP) 54,09060,92153,33066,93874,07290,91990,580$ 98,892Operating net income (non-GAAP) 2,5292,7252,4602,7252,8683,9193,6193,619Intangible amortization, net of tax 56,61963,64655,79069,66376,94094,83894,199$ 102,511Tangible operating net income (non-GAAP) 10.10%12.11%10.67%9.67%11.71%9.80%12.51%14.41%Return on tangible equity 10.67%11.95%10.44%12.13%12.74%13.73%13.74%14.56%Operating return on tangible equity (non-GAAP)
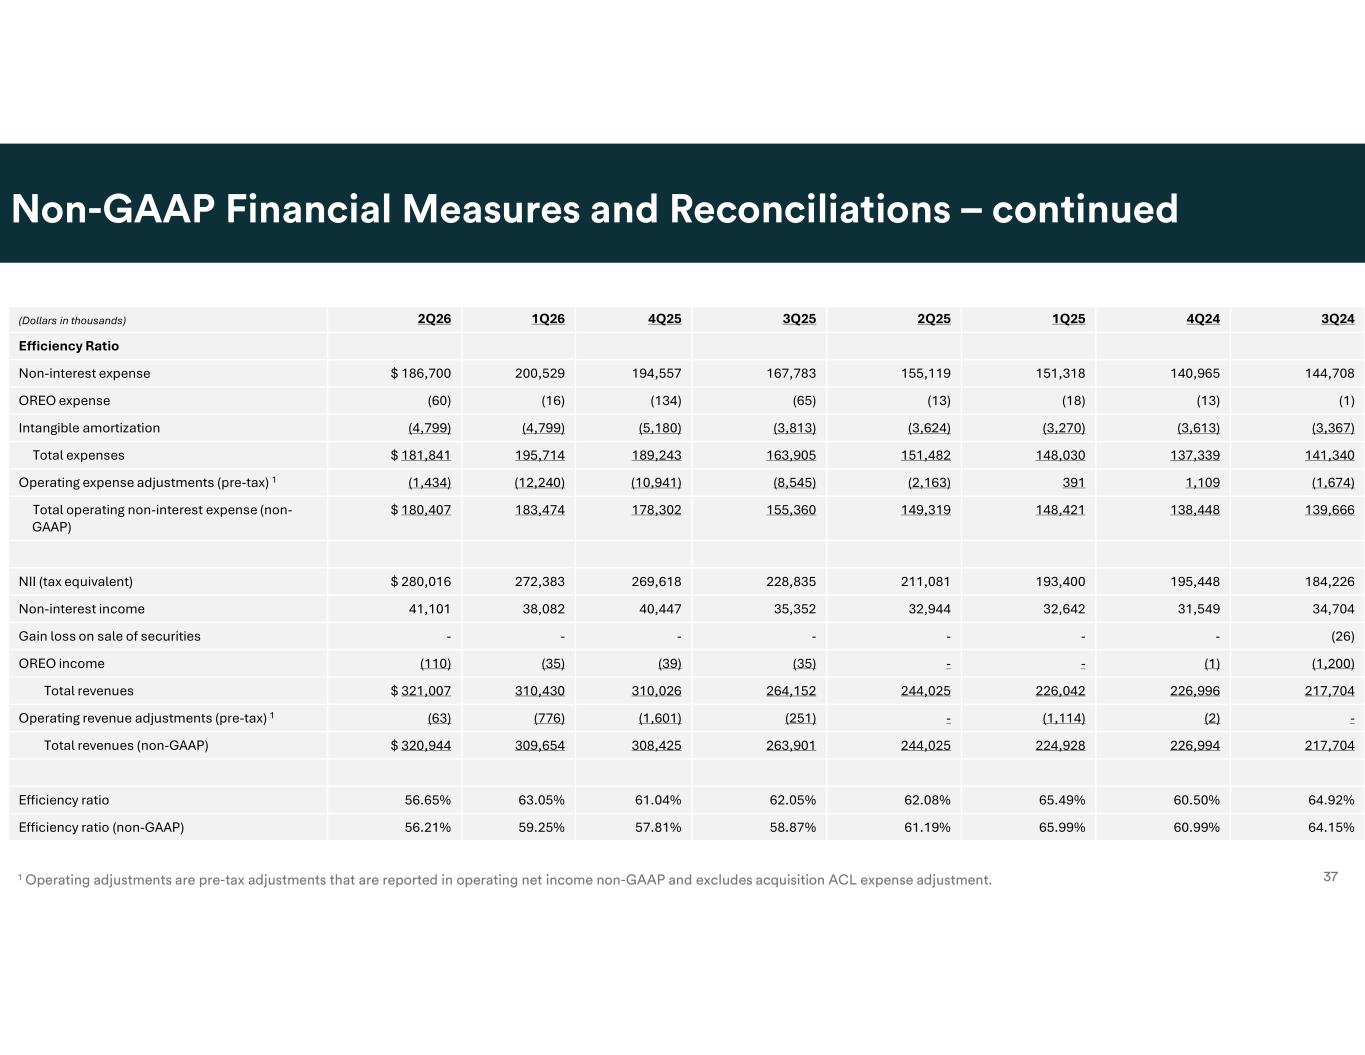
3Q244Q241Q252Q253Q254Q251Q262Q26(Dollars in thousands) Efficiency Ratio 144,708140,965151,318155,119167,783194,557200,529$ 186,700Non-interest expense (1)(13)(18)(13)(65)(134)(16)(60)OREO expense (3,367)(3,613)(3,270)(3,624)(3,813)(5,180)(4,799)(4,799)Intangible amortization 141,340137,339148,030151,482163,905189,243195,714$ 181,841Total expenses (1,674)1,109391(2,163)(8,545)(10,941)(12,240)(1,434)Operating expense adjustments (pre-tax) 1 139,666138,448148,421149,319155,360178,302183,474$ 180,407Total operating non-interest expense (non- GAAP) 184,226195,448193,400211,081228,835269,618272,383$ 280,016NII (tax equivalent) 34,70431,54932,64232,94435,35240,44738,08241,101Non-interest income (26)-------Gain loss on sale of securities (1,200)(1)--(35)(39)(35)(110)OREO income 217,704226,996226,042244,025264,152310,026310,430$ 321,007Total revenues -(2)(1,114)-(251)(1,601)(776)(63)Operating revenue adjustments (pre-tax) 1 217,704226,994224,928244,025263,901308,425309,654$ 320,944Total revenues (non-GAAP) 64.92%60.50%65.49%62.08%62.05%61.04%63.05%56.65%Efficiency ratio 64.15%60.99%65.99%61.19%58.87%57.81%59.25%56.21%Efficiency ratio (non-GAAP)
38